Google PageSpeed tool was created to give webmasters an indiction of how their site will perform when analysed by the Google search engine. As Google takes a variety of different factors into consideration when ranking sites the tool gives an indication of the health of the site.
The score it calculated using a percentage, with different bounds of the score being coloured differently. Between 0 and 49 is poor and is coloured red, between 50 and 89 is average and is coloured orange, above 90 is considered good and is coloured green.
Getting a perfect score in the Google PageSpeed Insights tool is by no means the end goal of site performance improvements or even search engine optimisation. It will absolutely have some benefits in terms of your site traffic though and is worth including in your site key metrics.
I won't put all of the page speed rules in this article since they change depending on what version of the tool you use. Google has plenty of documentation on their developers website detailing exactly what is measured and how much of an impact it has on the score of the site.
I find that I can run the system one day and find one or metrics have been added or tweaked that then change the outcome. This then, will be a best practice approach that looks at some of the ways that you can improve your site to achieve the best score.
Since I've spent a lot of time looking at improving PageSpeed scores on sites I have been involved with. I have quite often managed to reach a score of above 90, with the occasional site reaching a perfect score of 100.
Running PageSpeed Insights
What is confusing is how to run the tool in the first place as there are a few ways to get this information and not all of them produce the same result.
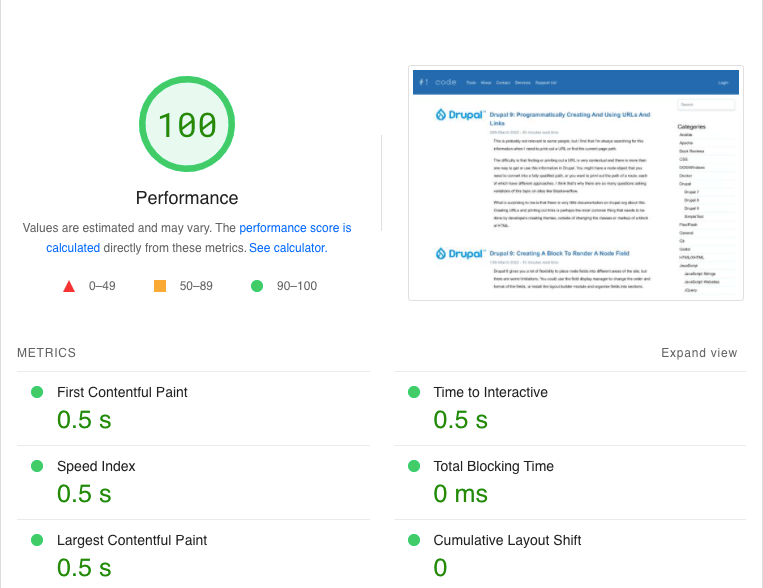
The usual way to measure the PageSpeed is to visit the site at pagespeed.web.dev and enter the URL you want to test into the form on that page. This will run through the performance tests and give you a final result.

You will see the tool beak the score into "Mobile" and "Desktop" variants. The main difference is that the mobile tests will be more critical of things that might slow the page down for mobile users, including large file sizes or slow page rendering.
At the time of writing this site gets a 98 for mobile and a 100 for desktop.
The second way is to install Google Chrome and run the Lighthouse tool through the developer tools. Along the top of the Google Chrome tool are a set of tabs, one of which is the Lighthouse tab. Running this will run some tests on your site and produce a result. Here is a screenshot of the tool running on this site (which also proves the high score).
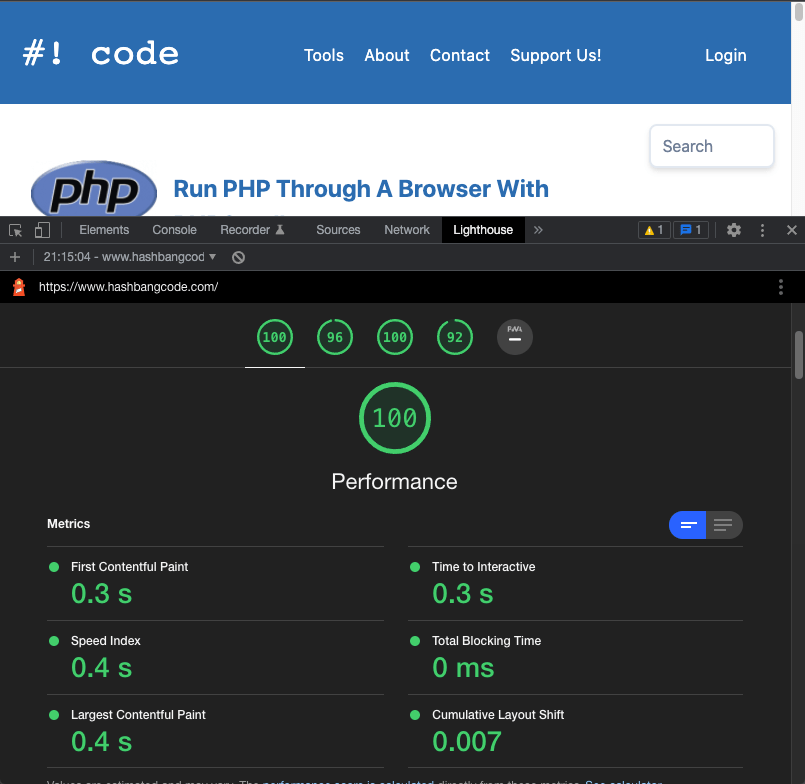
Note that the results also contain information on accessibility, best practice, SEO and progressive web app (if the site has that option available). I will be concentrating on the performance metric in this article, but you should absolutely be looking at getting the highest possible score across these metrics.
There also exists another tool on the page web.dev/measure/ that also runs the Lighthouses tests although it appears to produce different results. In fact, it produces a different result every time I run the tool. I'll not be using this tools results in this article, but it might be worth comparing this tool with the Lighthouse metrics.
A Look At The Metrics
The metrics of the PageSpeed report break down into six different metrics. These measure everything from the response time of your server to how long the page took to render.
- First Contentful Paint - First contentful paint marks the time at which the first text or image is painted. This is essentially the result of the initial page request to your server.
- Time to Interactive - Time to interactive is the amount of time it takes for the page to become fully interactive. It may seem strange to give this a separate measurement, but you will see this on some sites where the page is painted into the browser but there is a small delay between that and being able to click a link. This is the time to interactive difference.
- Speed Index - Speed Index shows how quickly the contents of a page are visibly populated. The speed index will differ greatly depending on what technology is being used to generate the site content. For static sites this will be the same as the first contentful pain since the content is already in the request. JavaScript heavy sites that pull in content through separate AJAX requests will cause this metric to rise slightly since separate requests are being made to populate the content.
- Total Blocking Time - Sum of all time periods between FCP and Time to Interactive, when task length exceeded 50ms, expressed in milliseconds.
- Largest Contentful Paint - Largest contentful paint marks the time at which the largest text or image is painted. For example, if you have a site with a large image then this will take time to load into the browser, which causes this value to increase.
- Cumulative Layout Shift - Cumulative layout shift measures the movement of visible elements within the viewport. Not all sites will have this metric, but if you load in fonts or use JavaScript move elements around or add styles then this can cause this metric to change. You can see this in action when you visit a site and see the page load and then "jump" as things interact with the page to cause the layouts to shift.
Outside of these metrics Google measures a lot of other factors that go towards having a good site, you can see a list of the issues towards the bottom of the report, which help and guidance about solving each of them.
What is nice is that the PageSpeed report understands that the site is running Drupal and will tailor the results to include links to important modules and documentation pages on solving some common problems.
Improving Your Google PageSpeed Score With A Drupal Site
There is no magic bullet that will solve all of your PageSpeed issues in one go. You should expect to work on a number of different things that go together to improve your PageSpeed score.
I will go through a number of improvements, modules, and settings that you can look at. I will try to address each point as specifically as I can, and will be introducing important modules where required.
Drupal Page Cache Setting
Configuring Drupal's built in cache system should be your first priority. Visit the performance configuration page at /admin/config/development/performance and make sure the page cache setting is set to a decent value. What value you set depends on the amount of change that your site content has, so do some experimenting to get the correct value for the content you are creating.

Drupal is clever enough to invalidate parts of the page cache so when you update a page it will then invalidate the cache for that section and allow that new content to be pulled through. This means that you don't need to worry about flushing all the caches every time you change some content.
As the PageSpeed tool will analyse the page as an anonymous user the score it gives will be based on the anonymous content.
Drupal Cache Headers
Look at the headers coming from your site. You will see two headers called x-drupal-cache and x-drupal-dynamic-cache. These headers tell you the current state o the cache of the page with possible values being "HIT", "MISS" or "UNCACHEABLE".
The ideal situation you are looking for would look like the following, with both the cache readers reporting a "HIT" status.
x-drupal-cache: HIT
x-drupal-dynamic-cache: HIT
Realistically, you will easily be able to get the x-drupal-cache to correctly report "HIT", the x-drupal-dynamic-cache might be more difficult. If you can't get the x-drupal-dynamic-cache then don't worry too much as you should be able to achieve the result you want from the PageSpeed tool.
Tracking down problems with the cache can be quite complex. One setting that Drupal has that can really help is http.response.debug_cacheability_headers, which can be found in the services.yml file in the site/default directory. To turn this on set this value to "true" and flush the Drupal caches.
http.response.debug_cacheability_headers: true
With this setting in place, the headers X-Drupal-Cache-Tags, X-Drupal-Cache-Contexts and X-Drupal-Cache-Max-Age are added to the response. These headers tell you what elements interacted with the cache to produce the response and can give you an indication of where the problems are coming from.
Perhaps the simplest way of solving cache issues is with the the Devel module, which contains a module called Web Profiler. This profiler tool can be used to inspect what is going on inside the page, including what is causing the cache to be invalidated.

Drupal 8 (and 9) are much better than Drupal 7 at making sure the cache setting on the page is correct. If you put a form onto a page in Drupal 7 then you had to work quite hard to prevent it from invalidating every page cache across your site. With Drupal 8, you can better track down any problems with your cache and implement workarounds to help solve them.
Performance Testing
Once you have your cache layer sorted out you should look at the raw performance of your Drupal site. The quicker the raw response from your server, the higher the Google PageSpeed result will be as the the first contentful paint metric is based on the amount of time taken to get the contents of the site. Once that value is at a reasonable level then you can concentrate on solving some of the other metrics as they are more dependent on the styles and scripts the site runs.
There are a few tools that you can use to test the performance of your site.
The Web Profiler module that comes with Devel can tell you things like the number of modules installed, the number of database queries made, how your cache layer is behaving and the number of requests being made to fetch all of the assets of the page. It can also give you more information about any errors that your site may have, which is handy for debugging.
Using tools like Xdebug or XHprof (also known as Tideways) you can see the exact call stack of your website, both of which include the path of execution that took the longest to render the page. These tools are useful to see where your performance bottlenecks are and are fairly easy to set up and get results.
One word of warning is to make sure that you view the profile of the second page response from Drupal after a cache clear. The first page response spends a lot of time dealing with discovery and creating the caches and so will be much, much slower than a fully cached Drupal page response.
Chrome and Firefox will give a lot of statistics about the response times and rendering of the site in their developer tools. Look at long load times and large files that cause slowdowns in your site speed.
Outside of these tools there are a few services that you can use to drill down into the performance of the site. I have used New Relic extensively to find and solve performance bottlenecks on large sites, and although the paid tiers are expensive, the free version does give you enough information to go from.
Performance should be sorted out in a feedback loop by solving problems and then running the local Lighthouse tool to ensure the solution works. Performance improvements have diminishing returns so you need to make sure that you are providing value to the site by spending time adding tiny performance improvements to the site.
Use A Content Delivery Network
The simplest way of providing quick content is to cache the response from your server and simply host it near to the user who is requesting it. This is essentially how a content delivery network (CDN) operates. There are lots of CDNs available and many of them provide comparable services.
For Drupal sites I have found that Cloudflare and Fastly work very well, and have lots of configuration items to allow you to tweak how the cache works. One thing that might trip you up is that some pages in Drupal can have large POST requests, so you need to be able to ensure that the CDN lets these large requests through, even if that's only for a certain group of users.
From a PageSpeed perspective you will definitely see a benefit, but only if your site performance and cache are working perfectly. With anonymous pages cached correctly in the CDN system you can easily see massive page speed increases without having to do much with your site. Without a decent cache response and the core performance of the site working then you will find that a CDN won't give you much benefit.
A CDN does more than serve anonymous content though. You can allow the CDN to serve your static site assets through its service, meaning that requests to your server for CSS, JavaScript and image files will be vastly reduced.
Increase Expiry Of Static Asset Caching
A static asset is anything that is served outside of the dynamic files that Drupal manages (which includes the private files downloads). All images, CSS, JavaScript or any other downloaded files are denoted as static content. By default, Drupal add a header to these assets that allows them to be cached for 2 weeks, which means that every 2 weeks your users need to download all of your assets again. Doing so is quite inefficient, especially if those assets don't change.
This setting is defined in the .htaccess file, which is required since Drupal it not bootstrapped during the serving of static assets.
  # Cache all files for 2 weeks after access (A).
  ExpiresDefault A1209600
The PageSpeed tool will reduce your score if you have a cache timeout of less than a year, so setting this to a year will increase your score.
  # Cache all files for 2 weeks after access (A).
  ExpiresDefault A31536000
If you are using a CDN to manage your content then it is likely that the cache value will be overridden to some other value. You'll need to look into the configuration to increase this value to at least a year.
You can test this by looking at the headers of your static assets and looking for the Cache-Control header. It should have a value of 31536000, which is roughly the number of seconds in a year.
cache-control: max-age=31536000
Having a small cache is fine when the site first launches, but should be set higher as soon as the site settles down. Drupal adds cache busting parameters to most files it generates so things like image styles, CSS and JavaScript files can be flushed if needed from within Drupal. If not, you CDN should have some cache invalidation tools that you can use to flush the caches.
Aggregate CSS And JavaScript Files
A simple thing that you can do to increase the speed of your site is to turn on CSS and JavaScript aggregation. This will turn the multiple files that Drupal has regarding the different CSS and JavaScript on the site into as small a number of files as possible. To turn this on, head to the page at /admin/config/development/performance and make sure both of the checkboxes at the bottom are on.
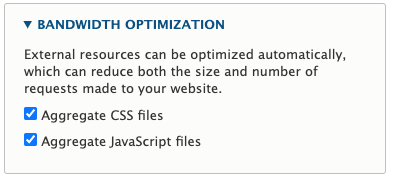
You might be wondering how this can increate your PageSpeed score. By simply reducing the number of raw HTTP requests made to the server you will decrease the time taken to download you site and all of the assets that make your site work. This will essentially reduce the first contentful paint time in the PageSpeed metrics. It can also help to reduce the "cumulative layout shift" metric since all of the assets are loaded earlier in the page request process.
I once heard a story of a Drupal website that was launched with much celebration and quickly went offline within a few hours. The problem was that the site was launched without this option turned on and so the traffic visiting the server was causing so many extra raw HTTP requests that the server couldn't keep up with the demand and so the site went offline. I always keep this story at the back of my mind when looking at Drupal sites and is one of the first things I recommend when performing audits.
Install The AdvAgg Module
Turning on CSS and JavaScript file aggregation can be further enhanced by the AdvAgg (or advanced CSS/JavaScript aggregation) module. This module has a lot of different options and tweaks you can make to the assets on your site, including both minimising and compressing the assets of your site. By further reducing the size of the files that are needed to display your site correctly you increase the performance of the site overall.
With regards to PageSpeed metrics, Google will measure your CSS and JavaScript to see if it is minimised and compressed so you can lose points if this isn't the case on your site.
As some settings can break your site I would suggest turning them on and seeing how far you can push things before the site starts to malfunction. You can then either fix the problems with the codebase that are causing problems, or dial back the AdvAgg settings a little to allow the site to function.
The AdvAgg module is another of my go-to modules when configuring a site as it further reduces the time taken to download and process all of the assets your site has.
Minify HTML
In addition to reducing the footprint of JavaScript and CSS you can do the same with your page content by removing any comments and line breaks from the source code. This is accomplished in Drupal by using the Minify Source HTML module.
This is a pretty simple module that reduces your page source down to the bare minimum, which basically turns the HTML source into just a few (quite long) lines.
If you are working on this module locally and don't want to config split out the modules configuration then you can simply turn off the module by adding this to your settings.php file.
$config['minifyhtml.config']['minify'] = FALSE;
$config['minifyhtml.config']['strip_comments'] = FALSE;
As the module can also remove comments it means that any HTML comments placed into your site source code will simply be removed.
I have used this module to instantly reduce the page load size on rescue projects by removing all of the HTML comments from the source code. Whilst this doesn't give massive improvements to your PageSpeed metrics, it will improve the time taken to transmit the site and so will improve the first contentful paint metric.
Reduce The Number Of DOM Elements
Previous versions of Drupal were said to have "divitis", meaning that there were so many div elements on the page that the content of a single field could be nested over 50 levels deep into the page. This creates a large Document Object Model (or DOM) and will increase the memory usage needed by the browser to store it. Large DOM sizes also cause longer calculations when applying styles to the page.
The PageSpeed tool will penalise you if the DOM of your site has over 800 elements and error when the DOM is over 1,400 elements. You will also lose points if your have more than 32 levels of nested elements.
Reducing the DOM size in Drupal can be quite challenging, especially since the platform is so modular. Every entity, field, and item gets wrapped by at least one div, sometimes more. The only way to really change this is to look carefully at your template files and remove any extra markup that isn't needed.
This metric is a little tricky to manage though. I find there is a balance between pages that contain content what users want to read or use, and reducing the number of elements on a page. The DOM size on this site can get quite high when the article size is long just due to the amount of content written. I certainly don't agonise over this aspect when creating content as I consider the content of higher value than the PageSpeed score.
Trying to keep the nesting level of your elements should be more of a concern since traversing the DOM tree can be time consuming if everything is buried deep inside the tree. For example, the amazon.com homepage, despite everything that's displayed there, only has a nesting level of 17.
Remove Unused Styles
Drupal will add a number of CSS files to your theme, even if you didn't extend a base theme.
You might need some of these files in your theme, but I tend to find that removing everything and then adding back in the files you really need is the best course of action. Removing styles that aren't needed by your front end theme is key to this as it is important in improving your overall page size.
To remove CSS files you need to add a libraries-override directive to your themes .info.yml file, adding a value of "false" to each of the files you want to remove.
libraries-override:
  system/base:
    css:
      component:
        css/components/ajax-progress.module.css: false
        css/components/align.module.css: false
        css/components/autocomplete-loading.module.css: false
        css/components/fieldgroup.module.css: false
        css/components/container-inline.module.css: false
        css/components/clearfix.module.css: false
        css/components/details.module.css: false
        css/components/item-list.module.css: false
        css/components/js.module.css: false
        css/components/nowrap.module.css: false
        css/components/position-container.module.css: false
        css/components/progress.module.css: false
        css/components/resize.module.css: false
        css/components/sticky-header.module.css: false
        css/components/system-status-counter.css: false
        css/components/system-status-report-counters.css: false
        css/components/system-status-report-general-info.css: false
        css/components/tabledrag.module.css: false
        css/components/tablesort.module.css: false
        css/components/tree-child.module.css: false
Once you flush the caches your theme layer will have less styles associated with it.
One word of warning is that some styles are actually needed by certain processes in the site, so you might find some of the default styles don't work any more. If you do need the styles then you can easily fetch them from the original file and incorporate them into your own theme files. Many of the above CSS files don't actually have a lot in them so it's quite simple to incorporate them into your theme's custom CSS and manage them independently of Drupal.
You should look at doing at least an audit of the JavaScript files on your site. Drupal 8+ will only load a JavaScript file (and its parent dependencies) into the page if the functionality it provides is needed, but sometimes you'll find that a misconfigured module will add script files to all pages, even when they aren't needed. Tacking these down and removing them with hook_page_attachments_alter() will help increase your score.
Eliminate Render Blocking Resources
The first contentful paint and largest contentful paint of your page can be blocked by downloads that need to happen (and be processed) in order for the browser to display the web page. What this means is that whilst the page is busy downloading the CSS and JavaScript for your site, your users will be sat there waiting for the page to render. This wait time is called time to interactive in the PageSpeed metrics and you can lose points if this takes too long.
It's somewhat difficult to get around this problem as you do need to load some CSS files to render the page, but you can mitigate it in a couple of ways.
- Avoid the use of @import statements in your CSS files. Using @import statements means that the browser needs to make an additional HTTP request to fetch the extra CSS file. As this can only be done after the CSS file has been parsed it in down the page render.
- Optimise the CSS so that you remove any styles that your site doesn't need. This is especially important when using CSS frameworks like Tailwind as the Tailwind package is quite large and you don't need to use all of it. Chrome has a Coverage tab that can tell you how much of your CSS isn't being used on any given page.
- Minimise and reduce your CSS down as much as possible so that it can be served in one or two small files.
- It's also possible to defer CSS files by using JavaScript to load them in after the page has finished the core render process. This way you can load in the core styles and defer the other styles for later in the page load cycle.
To avoid render blocking JavaScript you can move all of the script tags to the bottom of the page. You can further ensure that they will not be part of the initial page load by adding the defer attribute. The JavaScript dependencies in Drupal let it know which files need to be loaded first and will ensure that your scripts are added in the correct order.
Solving some of these render blocking problems will be down to the theme itself. You need to ensure that your theme behaves correctly with the assets it serves as you work to solve these problems.
The core Drupal CSS and JavaScript aggregation performs quite well in this regard by combining and minimising CSS. The AdvAgg module can also help to further reduce and minimise your assets.
You can also install the AdvAgg Modifier module (included in AdvAgg) in order to further defer the CSS and JavaScript on the page. This, however, might cause compatibility problems with other modules and so you'll need to experiment with the correct combination.
Resize And Reduce Images
The rule of thumb for images is to simply keep their use to a minimum. The PageSpeed tool understands that you will be using images, but if you have lots of large images on your site then it will have a detrimental effect on the score since it will simply take a long time to download them.
Drupal's image handling is quite advanced, although you need to set up things in the right way at the start. By using the core Media module you can ensure that Drupal will resize and reduce the size of all images you upload thanks to the image styles system.
By using image styles you can ensure that the image is smaller than the original. Users will often just upload an image that looks good or is simply much too large for the size it needs to fill. This means that the uploaded 3000x3000 image is reduced to 200x200, which takes far less time to download.
When using fields you need to ensure that the output is sent through an image style that resizes the image to the correct dimensions for the element it is being rendered into. Embedding images in to text areas means you also need to use Drupal's media library to allow users to embed images as this will also pass the image through the same system.
By combining image styles with the core Responsive Images module you can further ensure that the image loaded into the page is the correct size for the viewport. This prevents the large image that a desktop user would see being downloaded by a mobile user.
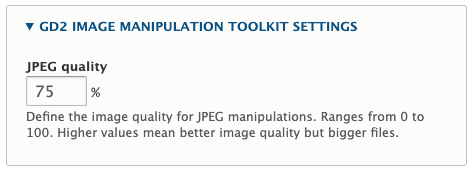
In addition to resizing the image you should also look at further reducing the size of the image files. The page at /admin/config/media/image-toolkit allows you to control the quality of jpeg images that the site passed through the image styles. Setting this quality value to something around 75% will reduce your image size a lot, whilst not having a noticeable effect on.
You can also do the same thing with png image formats. The TinyPNG Drupal module can be used to send your images through the TinyPNG service, which can often reduce the file size quite a bit. I've normally found a file size reduction of 20-30% for most of the images I upload to this site. This is before they are resized by the image styles so there are further reductions to be made when the images are printed out. The TinyPNG module needs an API key, but the free tier allows for 500 images to be processed, which is more than enough for my needs.
Use Next-Gen Image Formats
The PageSpeed tool will often tell you to "Serve images in next-gen formats" and can reduce your score if you use jpeg or bmp images on the site. This is understandable since bmp images aren't exactly optimised for being web images. This recommendation, however, centres around the use of WebP and AVIF format images since they are smaller and have better compression than other formats (including png).
I often take this metric with a pinch of salt as I feel that Google is trying to push its own image formats of WebP and AVIF. You can allow support for formats like WebP by using the WebP Drupal module, but you also need to ensure that your hosting environment can process and serve WebP image formats. Browser support for WebP has only very recently become widespread (it's not fully supported on Safari yet). AVIF images have even less browser support and are only really fully supported in the latest versions of Chrome and Opera.
As long as you are serving small, size reduced png images then you shouldn't be tripped up by this setting.
Set Image Height And Widths
If you don't set a set a height and width on images then the browser doesn't know how big to make the available box for the image until the file is dowloaded and placed into the page. This can cause layout shifts where the image can "pop" into the page and cause surrounding elements to move out of the way, causing your PageSpeed score to reduce.
By adding height and width to image markup you allow the browser to allocate space for the image, which prevents the image from causing layout shifts.
<img src="/sites/default/files/styles/some_style/public/image/some_image.png" width="250" height="250" alt="Some image" loading="lazy" typeof="foaf:Image" />
Generally, the image styles will add in these attributes, but I have seen them being missed out in some situations where custom templates are created. This should be a pretty simple fix to your templates and is something to watch out for.
Lazy Loading Images
Lazy loading is a technique that allows users to only download the assets on the page when they need them. This means that any image that isn't in direct view of the user isn't downloaded until the user scrolls down and moves those images into view.
This technique has an obvious impact on the initial load size of the page since not all of the assets are downloaded when the page is loaded.
The Lazy Drupal module allows lazy loading to be used on a Drupal site, but it does take a little bit of setting up. If you are introducing this module into an existing site then you may have to move a few things around (image styles, responsive images etc) to get this working correctly. If you are starting out on a new site then add the Lazy module straight away to make the setup easier.
Remove Adverts
When I was working towards improving this site's page score I kept seeing my scores degraded by the adverts I had on my site. Every time I ran the tests they would be reduced by at least 10-15 points just due to the adverts that the site had. It was a little ironic that Google's PageSpeed tool was being tripped up by Google's adverts, but there we go.
The issues centred around two problems. The JavaScript used to load and render the adverts was causing problems due to it being poor quality. This was either render blocking from a third party service, or not being properly minimised. Secondly, once the adverts were loaded in they often triggered secondary problems themselves with layout shifts within the advert blocks, accessibility problems or large image sizes.
My solution in the end was to simply remove them. I instead went for a community funding approach through Patreon and BuyMeACoffee, although I haven't managed to cover hosting costs since adding those services. My thinking was that with ad-blockers in common use (especially amongst the audience who visit this site) so removing the adverts would not be noticed by most visitors who found this content useful.
If you do need to add adverts to your page just be sure to add the correct size to the advert blocks to prevent them from shifting layout as the advert is loaded. That layout shift will cause you to lose more points than the poor JavaScript.
Conclusion
If you feel disheartened that you can't get that perfect score then remember that you may never reach it. Anything in the high 90s is very good and even large, well trafficked sites will often not have very high scores in this tool. Remember as well that PageSpeed scores can fluctuate quite a bit from one test to the next so make sure you run any tests a few times over a few days to look at trends in the results.
You also need to think about these aspects across your entire site. Select some high profile pages and test your site using PageSpeed on each of these pages regularly.
As for a plan of action you should look at tackling items in terms of diminishing returns. This means solving problems like page speed before looking at the image dimensions or the expiry time on static assets. You will see a much higher degree of improvement solving the fundamental issues with your site than solving minor issues.
Of course, the ultimate questions is "does a perfect score matter?" and the truth is that the score itself isn't overly important. What is important is the recommendations contained in the results section and the improvements you can make to your site. The tool will tell you where the page isn't performing to it's fullest potential and why and these improvements can only help to give your end users a better experience.
By including the PageSpeed score in site metrics you can preempt tech savvy clients who will use the PageSpeed score to ensure that their site is performing correctly.
Let me know if I have missed anything out here, or if there are any Drupal modules that help with any of this. I've almost certainly forgotten to include something since this is a large subject matter and there are lots of different approaches to these problems.

Comments
Very useful suggestions, thanks!. One note regarding WebP: Drupal 9 supports it natively (by using a convert action), as long as PHP GD is compiled with WebP support.
Submitted by John on Tue, 04/05/2022 - 01:43
PermalinkThanks John, useful tip!
Submitted by philipnorton42 on Tue, 04/05/2022 - 08:23
PermalinkAdd new comment