I have been searching for a good server monitoring solution for a while so that I can keep an eye on some of the servers that I run. Tools like Smokeping, Cacti and Nagios seemed promising at the outset, but they are more concerned with bandwidth and server status, not how the server is running. What I really needed was a way to find out how much memory a server was using, how many Apache requests were being made, what the average load of the server was, and also some way of letting me know when things were under strain.
I did find some tools like New Relic and AppNeta that seemed to fit the bill, which have large feature sets, and nice graphing and reporting solutions. The only major hurdle for me was that they are expensive, especially when I was considering setting this monitoring system up on my home server for my own projects.
After not finding anything I decided to create a system that ran the uptime command on a remote server and recorded the output. uptime is a Linux command that has varied output between systems but will report on how long the server had been running, how many users are logged in and what the load average of the server is. Here is an example output from my local machine (which was doing a lot of code updates and database processing on a development site at the time).
10:42:44 up 1 day, 20:36, 4 users, load average: 0.97, 1.07, 0.90
I used Phing to allow me to run the uptime command on a remote server and capture the result. The ssh task can be used to send any command to a remote system and capture the output in a property. So I used the ssh task to get the output of the uptime command and store it in a property called monitor.uptime.
<ssh username="${monitor.username}" password="${monitor.password}" host="${monitor.host}" command="uptime" property="monitor.uptime" />
With the output of this command in a property I then used some other processing to extract the data needed and add this to a log file, which was updated thanks to a cron task that just ran the Phing file every 2 minutes. With this log file I created a web page that then graphed the output using Flot charts. This took me an hour to put together and all worked nicely, but the major flaw was that in order to add more options I would need to use a separate ssh task, and each task then added another ssh call to the server. This was aside from the massive security issues surrounding automated ssh logins using passwords stored in plain text.
I ran the Phing script for a day, but I was still looking for a better solution to monitoring server performance. After posting about the Phing script (and how mad it was) on Facebook Jeremy Coates posted a quick message about a system called Munin. Thanks Jeremy!
Munin is a system that uses a set of Perl scripts to poll external systems to bring down information about server performance statistics. The data found is then written into a series of graphs that represent the data by day, week, month, and year. By default you get access to things like CPU usage, memory usage, system load, disk access times, processes, uptime, and network traffic. The system is modular so it can be extended to include Apache load, Varnish statistics, MySQL load, and even the number of emails sent.
After using Munin for a couple of weeks I am really impressed by how much data I can view, and it has even allowed me to track down a performance issue on a server. It's pretty easy to install, but I thought that other people might benefit from me writing down some notes on getting up and running with Munin.
Install Munin Server
The first step in getting up an running with Munin is to install a Munin server. This is the primary hub of the Munin reporting tool and where you can view the data from each of your Munin nodes. Setting up Munin on most systems is pretty easy, just use the following apt-get command on Debian/Ubuntu setups.
sudo apt-get install munin munin-node
If you are on Centos/Redhat then you can use the yum package manager in the same way.
sudo yum install munin munin-node
In order to view the Munin graphs via the web interface you might also need to install the libwww-perl package. This is required by Apache to run Perl scripts and is necessary in order to allow the server to show the Munin graphs.
Additionally, you might also want to install the munin-plugins-extra package. This package contains a bunch of extra modules that allow you to capture results for things like Apache, MySQL or Varnish that are on top of the normal CPU and memory usage statistics. You can do this as a separate step or as part of the installation of the Munin server. You might also be wondering why we are installing a Munin node on the server. This isn't essential and it will be used to report on the status of the server itself, but it's a good test to see if things are working correctly and lets you keep an eye on how things are running locally. My Munin server is hosted on a machine that does a bunch of other things so it makes sense to install the node along side this in order to make sure the rest of the services are able to run.
The Munin graphs are shown in a web interface (i.e. through a web browser), but you'll need to properly set things up so that you can view the graphs. After installing Munin server on a few different systems as a test I have found that some systems (e.g. Ubuntu) will set everything up, whilst others tend to leave the finer detail to the administrators. On Ubuntu you can edit the file /etc/apache2/conf.d/munin in order to configure the location of the Apache webroot. By default this will only allow access from the localhost IP address and so you might want to add a couple of Allow rules. To allow everyone to access the Munin web interface use the following.
Allow from 0.0.0.0
To allow everyone from your local network use something like the following.
192.168.1.0/24
Be careful though, if you use port forwarding between your router and the Munin server you will essentially be allowing access from the outside world to your Munin interface. This is because internally the request appears to be coming from the internal network. This data is not the sort of thing you want everyone to see!
The main Munin server configuration file is located at /etc/munin/munin.conf. There are a few configuration options to see here as well as the setup of where the Munin nodes are located. The default Munin configuration options are usually fine, unless you need to alter the directories Munin uses to write out the graphs. For example, if you changed the Apache webroot then you will need to alter the config option htmldir to point to the same place.
Now you have Munin installed you should be able to view the web interface via the address http://localhost/munin. By default you will see the statistics for localhost, as long as you installed the local Munin node. On installation a cron job is also set up that automatically updates the Munin data every 5 minutes and so it will take a little time for the graphs to start filling up.
Setting up a node for Munin is probably your primary reason for editing the munin.conf file. The minimal node configuration you need is the display name of the node (for the web interface) and the physical address of the node.
[www.hashbangcode.com]
  address 10.0.0.1
You can also group the hosts together, which helps when viewing the results as they will be grouped in the same way. Grouping has the following format:
[MyHost;]

[MyHost;www.hashbangcode.com]
    address 10.0.0.1

[MyHost;www.example.com]
    address 10.0.0.2
The address config option is the minimum needed to get a Munin node working.
To control the updating of a Munin node use the update node level directive. This defaults to 'yes', but you can set it to 'no' to turn off the updates but retain the data and show the data on the graph.
[www.hashbangcode.com]
  address 10.0.0.1
  update no
To change the port that Munin uses as a default (4949) use the port node level directive. This is useful if you have to use a different port.
[www.hashbangcode.com]
  address 10.0.0.1
  port 12345
The use_node_name directive determines whether the IP address or the node name (i.e. the name between []) is to be used to contact the node. This defaults to 'no', but can be useful to set to 'yes' when the IP address isn't translated into the correct server address. This might be the case if you are using Munin in an internal network and have a strict firewall policy, but for the most part you can leave this alone.
[www.hashbangcode.com]
  address 10.0.0.1
  use_node_name yes
There are a lot more options than I have shown here. For more information about using the config file take a look at the Munin documentation on config files.
Installing Munin Node
Munin is a useful tool when viewing localhost statistics, but creating nodes is really where the power lies. As I have said previously, Munin works by having a central server polling remote nodes to draw down the data. So when we install Munin as a node we are only installing a small component that reacts to incoming Munin requests. This is actually an important concept with Munin, if your server doesn't ask the nodes for results (e.g. because of a network failure) then the data is not be generated and your Munin graphs will have holes in them. Your Munin nodes will not keep hold of data until the next time it can give them to the server, they don't even generate it.
To install a Munin node on a Debian/Ubuntu server use the following command.
sudo apt-get install munin-node
To install a Munin node on a Centos/Redhat server use the following. If this fails or is not found then you might need to have the EPEL repository installed as a prerequisite.
sudo yum install munin-node
Now that the Munin node is installed you'll want to look at the config file, which can be found at /etc/munin/munin-node.conf. The following is a typical Munin node configuration file.
log_level 4
log_file /var/log/munin-node/munin-node.log
pid_file /var/run/munin/munin-node.pid

background 1m
setsid 1

user root
group root

# Regexps for files to ignore
ignore_file [\#~]$m
ignore_file DEADJOE$
ignore_file \.bak$
ignore_file %$
ignore_file \.dpkg-(tmp|new|old|dist)$
ignore_file \.rpm(save|new)$
ignore_file \.pod$

#host_name localhost.localdomain

allow ^127\.0\.0\.1$
allow ^::1$

# Which address to bind to;
host *

# And which port
port 4949
By default this node only allows access to the Munin data from the local machine. Before you can use the Munin node you need to add your IP address as an allow rule in this config file.
Once that is done, it's probably a good idea to make sure that the server the node is installed on allows external connections on the Munin port (4949). For this you will need to check your iptables configuration. To view the current iptables configurations you have use the following command (the sudo is important).
sudo iptables -L -n
If no reference to the Munin server IP address on port 4949 exists then you will need to create one. Here is an example of adding a iptables rule for a Munin server.
sudo iptables -A INPUT -p tcp --dport 4949 -s 10.0.0.1 -j ACCEPT
When you run the configuration lookup command (sudo iptables -L -n) a second time you should see the following.
Chain INPUT (policy ACCEPT)
target     prot opt source               destination
ACCEPT     tcp  --  0.0.0.0/0            0.0.0.0/0            tcp dpt:22
ACCEPT     tcp  --  0.0.0.0/0            0.0.0.0/0            tcp dpt:80
ACCEPT     tcp  --  0.0.0.0/0            0.0.0.0/0            tcp dpt:8080
ACCEPT     tcp  --  10.0.0.1       0.0.0.0/0            tcp dpt:4949
Everything is now set up, but you might notice that your Munin server doesn't connect. The reason is that when you change any of the rules in your Munin node you will need to restart the node for the options to be loaded. To restart a Munin node use the following.
sudo service munin-node restart
Or, if service isn't available then you can use this command instead.
sudo /etc/init.d/munin-node restart
When you install a Munin node for the first time you need to make sure that the service is running if the server is rebooted. To make sure the Munin node starts if the server restarts with the server you can use chkconfig.
sudo chkconfig --add munin-node
If that fails then try the alternative of.
sudo /sbin/chkconfig munin-node on
One final thing to remember is that if your host is running a hardware firewall then you'll need to allow connections to pass through that as well.
Troubleshooting
Getting started with Munin can sometimes be a little bit painful. For the most part everything installs and runs fine. My main problem was when trying to hookup a new node. There tends to be a lot of stuff in-between that can cause the Munin server to fail it's data polling. If you have any problems then remember that Munin logs everything. If you edit your server configuration file to add a new node and nothing appears to be showing in the web interface then have a look at the munin-update.log. It will usually tell you if there is a connection problem or if something wrong happened during the update process, which happens every 5 minutes. To view the last 50 log entries use the following.
sudo tail -n 50 /var/log/munin/munin-update.log
The Munin server uses a cron job set to run every 5 minutes in order to poll the Munin nodes. You need to make sure that the user who runs the cron is munin-cron. If nothing is being written to the logs then it's generally because the cron job isn't running. To view the cron jobs that have been setup for the munin-cron user use the following command.
sudo -u munin-cron crontab -e
What is good about Munin is that it uses a standard interface and so even if you install Munin 2.1 on your server and Munin 1.4 on your node the two will happily talk to each other so that tends not to be a problem.
Understanding The Output
Munin produces a lot of graphs and other data, and I could write an entire book about understanding it all. My first few days with Munin was trying to get to grips exactly what everything meant and if a graph with a certain value was a bad thing or not. Munin reports are spit into sections, which makes pinpointing issues really handy. Here is a breakdown of a few of the graphs in different sections.
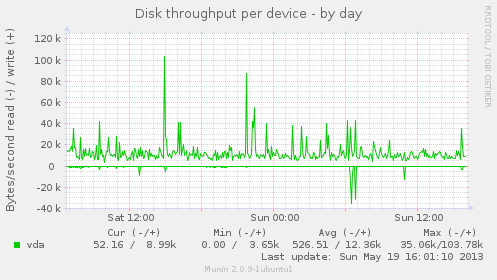
Disk
Disk throughput per device - This shows the amount of data being written or read from a disk. A disk will always be slower than memory when retrieving files, but a lot of disk reads can be a problem. For example, it could indicate that your database server doesn't have enough RAM and is therefore storing tables on the disk rather than in memory.
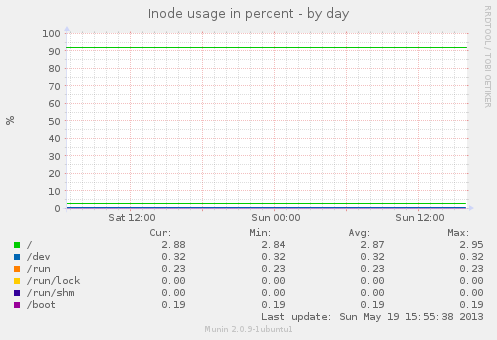
Inode usage in percent - Every file system has an index showing where every file is stored, what it's name is, and what the permissions of the file are. This has a physical limit, and when it gets full it means you can't create any more files, even if there is enough space on the disk. Keeping an eye on this value is therefore very important as it will quickly cripple or bring down your website.
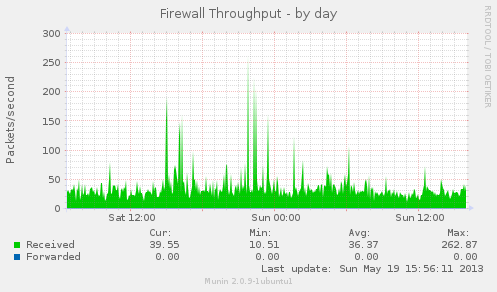
Network
Firewall Throughput - This is the amount of traffic going through the iptables firewall, which is generally all traffic on most servers. This is only important if you are running the Munin node on a router, firewall or gateway system.
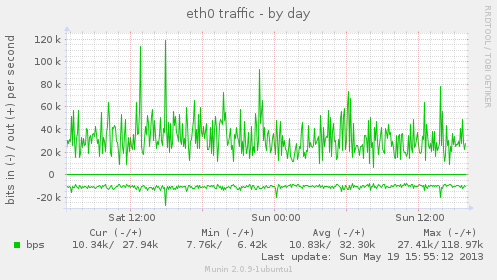
eth0 Traffic - The amount of traffic passing through the eth0 interface. Useful for keeping an eye on the available bandwidth on a web host.
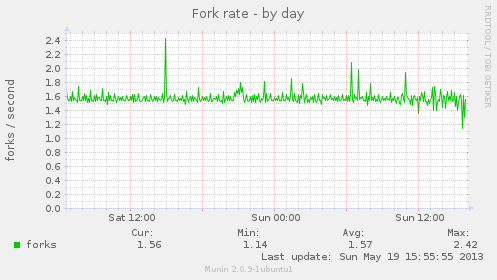
Processes
Fork rate - Processes are created by forking existing processed into two new processes. This indicates the rate at which new processes are created and can be an indication of a bottleneck if lots of processes are being created.
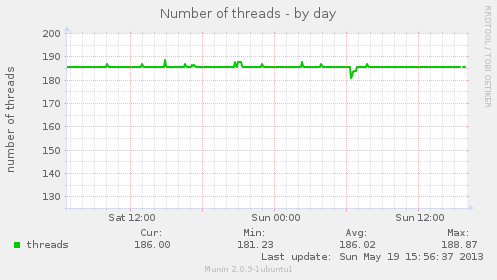
Number of threads - This is the total number of processes running on a system.
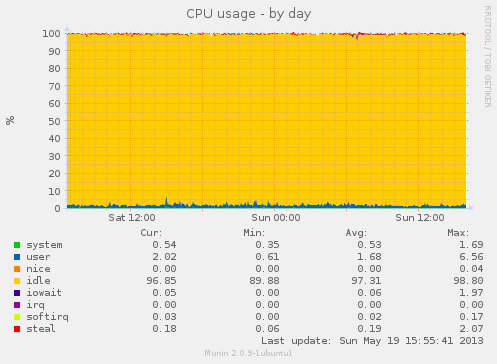
CPU Usage - This indicates the usage of the CPU and is divided into multiple parts. For example, iowait shows the amount of time spent by processes for IO (e.g. disk access).
System
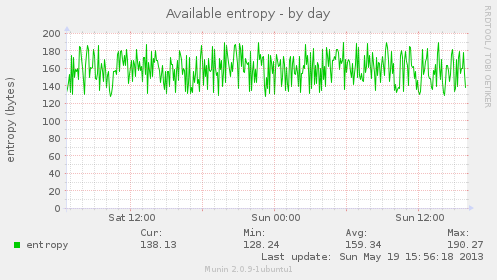
Available entropy - The entropy is the measure of the random numbers available from /dev/urandom. These random numbers are needed to create SSL connections. If you create a large number of SSL connections this randomness pool could possibly run out of real random numbers.
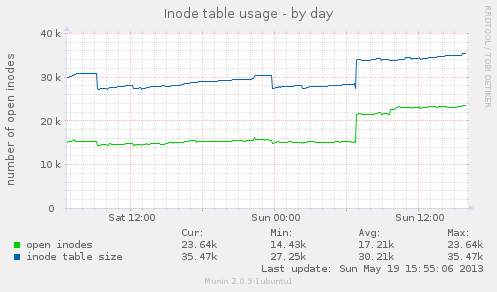
Inode table usage - This shows the total number of files that are open on a system. If this number increases suddenly then it might mean that there is a program on the system that is not closing files correctly.
Load average - This is a useful number that shows how much is trying to be run by the system. Numbers under 1.0 mean that there is enough resources to cope with the amount of work to be done. Numbers over 1.0 mean that the system is under high load and there are not enough system resources. Understanding Linux CPU Load - when should you be worried? is perhaps the best explanation I have seen for load average.
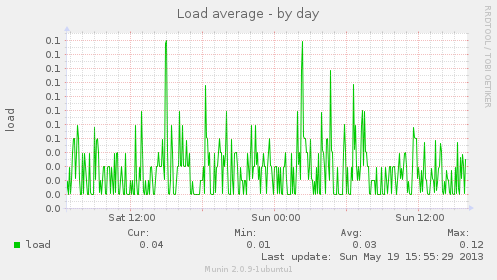
All of the above screenshots were taken from the Munin setup I have for #! code. Those of you who are familiar with the statistics Munin produces will see that the server isn't really under strain all that much. This is only a small sample of the statistics available from Munin, especially when you start to use plugins were you can view statistics for Apache, Varnish, MySQL, sendmail and a variety of other things. Setting up these extra plugins is usually quite simple, and quite often is done for you anyway.
Notifications
Looking at graphs is fine, but the real power of Munin is that it can tell you when things start going wrong. Built into Munin is a notification system that will highlight problems within the web interface but also contact you (via email as a default) when things reach certain limits. These limits are numbers that you need to set yourself, but doing so isn't too difficult. There are two levels of issues in Munin, warning is for when things might go wrong and critical is for when things really need attention. As these values are set arbitrarily it is up to you to decide what is a warning and what is a critical error.
The first step in setting up Munin to contact you when a problem arrises is to create a contact. To do this you just need to add something like the following to your servers munin.conf file. This tells Munin to always email the 'user' email address when a warning or critical issue has been found.
# 'user' can be any user you want it to be
contact.user.command mail -s "Munin notification" email@example.com
contact.user.always_send warning critical
The next step is to set up some warnings for your nodes. In the following example I am setting the load average warning threshold to be 15 and the critical threshold to be 20. This means that if the system load passes any of these two values Munin will let me know about it.
[www.example.com]
    address 10.0.0.1
    load.load.warning 10
    load.load.critical 20
A good tip here is that when you are trying out these values for the first time set the threshold to an intentionally low value so that they will be triggered. This ensures that the correct values are being watched in Munin and that the alerts will work correctly. Increase these values to sensible levels when you are happy that things will work when they are needed.
Comments
Submitted by Ian Lewis on Wed, 10/22/2014 - 12:00
PermalinkI like this site because so much utile material on here :D.
Submitted by China investing on Mon, 07/16/2018 - 14:31
PermalinkGreat article,
To make it even better, could you explain how you worked out the syntax for the warning :load.load.warning 10
in other words, where is the list of variables to check for ?
Cheers
Submitted by 3615JMD on Mon, 09/28/2020 - 14:01
PermalinkThere is no official list of Munin variables, it largely depends on what plugins you have installed.
The syntax of a service plugin is:
So, load is the service, load is the internal name, warning is the setting and 10 is the value.
Submitted by philipnorton42 on Tue, 09/29/2020 - 21:41
PermalinkAdd new comment