A parabolic curve is a type of curve where every point is an equal distance from a focal point. There a number of different way to generate this sort of curve using math, but one of the simplest is to use straight lines to create the illusion of the curve.
The curve is created by diving two axis into equal points and then drawing a line from the first point on one axis to the last point on the opposite axis. Each line of the curve is drawn in the same way, repeating the process of drawing a line between opposite points for every point along the axis.
The more lines we add to the graph, the more pronounced is the curve, but with just a few lines we can create intricate line drawings that appear to bend straight lines.
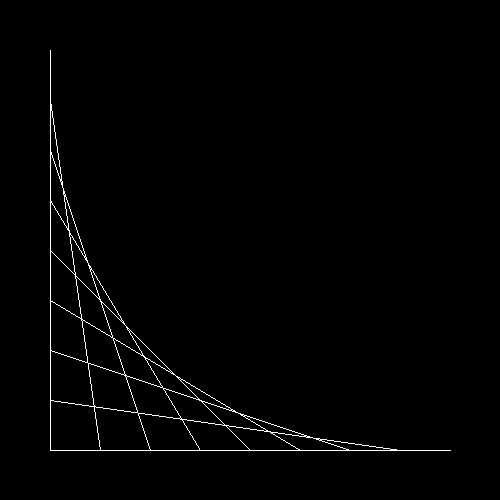
Here's a simple example of a parabolic curve created using straight lines.
The focal point of this curve is in the upper right hand side of the image, essentially on the opposite side of the card.
In this article, we will look at how to create a sample image in PHP, and then how to draw different parabolic curves on the image using just straight lines.
Creating The Image
For the rest of this article we will use the following code to generate an image, 500x500 in size, with a plain black background using the GD library in PHP. The white colour we create is used to draw the lines of the curve.
<?php

$height = 500;
$width = 500;

// Create the image reference.
$img = imagecreatetruecolor($width, $height);

// Create a color.
$white = imagecolorallocate($img, 255, 255, 255);

// -- Add code here that generates the lines in the image. --

// Generate the image.
imagepng($img, 'parabolic_curve.png');

// Destroy the image reference.
imagedestroy($img);
Drawing a line on an image in PHP is pretty simple, we just use the imageline() function, passing in the image resource, the coordinates of the start and end of the line, and the colour of the line. The coordinates system for images in PHP is based on the coordinate "0,0" being in the top left hand corner of the image.
For example, to draw a line from the upper left hand side to the lower right hand side we would use the following code.
imageline($img, 0, 0, 1000, 1000, $white);
The first parameter is the image resource, the next two parameters are the start coordinates of the line, after which we have the ending coordinates of the line. Finally, we pass in the colour we want the line to be, which is created through a call to the function imagecolorallocate().
Putting this code together generates the following image.

Now we have a canvas to draw on, let's star creating a line.
The Simple Curve
The first parabolic curve we can build is the simple curve against a single x and y axis. We have already seen an example of this in the image at the start of the article.
In order to draw the curve we will first need to calculate an offset value that will be used to offset the chart from the edges of the screen, and also to calculate how many lines there will be in the parabolic curve itself. We work this value out based on the height of the image, divided by a number. Essentially, the higher we set the number, the smaller the offset to the edges of the image, and the more lines we draw on the curve.
// Calculate the offset.
$offset = $height / 10;
This is a way of simplifying how the axis of the curve is created and how the lines relate to that curve.
Using this, we can then build the baselines of the chart, which is just two calls to imageline() to draw the lines.
// Draw the baselines of the curve.
imageline($img, $offset, $width - $offset, $offset, $offset, $white);
imageline($img, $offset, $width - $offset, $width - $offset, $height - $offset, $white);
With that in place we can how draw the lines of the parabolic curve.
To do this we just loop over the number of iterations of the offset value against the height of the baseline and draw the line between one baseline and the other. Essentially, what we are doing here is drawling a line between point 10 on the y axis and point 1 on the x axis in the first iteration. In the second iteration we draw a line between point 9 on the y axis and point 2 on the x axis. We then repeat this process until we reach the end.
// Draw the lines on the graph.
for ($i = $offset; $i < $height - $offset; $i = $i + $offset) {
  imageline($img, $offset, $i, $i, $width - $offset, $white);
}
Using an offset value of 10 meant that we draw 7 lines on the chart and it looks like this.
For example, here's the parabolic curve using an offset value of 30.
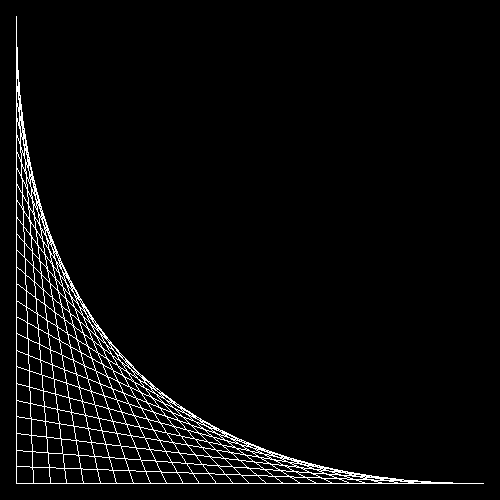
You can experiment with the offset value and see what sort of parabolic curve you can create. Setting the number very high causes all of the lines to overlap, basically creating a solid curve.
Creating A Diamond
Not that we have the basic parabolic curve sorted we can look at creating a diamond or star shape from and arrangement of 4 parabolic curves. This follows the same process, but instead draws 4 baselines and then draws 4 parts of the curve.
Here is the code in full, I've labelled the different corners of the parabolic curve so that it's easy to see which lines are drawing which parts of the curve.
// Calculate the offset.
$offset = $height / 10;

// Draw the baselines of the curve.
imageline($img, $centerPoint->x, $centerPoint->y, $offset, $centerPoint->x, $white);
imageline($img, $centerPoint->x, $centerPoint->y, $centerPoint->y, $height - $offset, $white);
imageline($img, $centerPoint->x, $centerPoint->y, $width - $offset, $centerPoint->x, $white);
imageline($img, $centerPoint->x, $centerPoint->y, $centerPoint->y, $offset, $white);

// Draw the lines on the graph.
for ($i = $offset; $i < $centerPoint->y; $i = $i + $offset) {
  // Bottom left.
  imageline($img, $i, $centerPoint->y, $centerPoint->x, $centerPoint->y + $i, $white);

  // Top Left.
  imageline($img, $i, $centerPoint->y, $centerPoint->x, $centerPoint->y - $i, $white);

  // Top Right.
  imageline($img,  $centerPoint->x + $i, $centerPoint->y, $centerPoint->x, $i, $white);

  // Bottom Right.
  imageline($img, $centerPoint->x + $i,$centerPoint->y,  $centerPoint->x,$width - $i, $white);
}
This generates the following image.
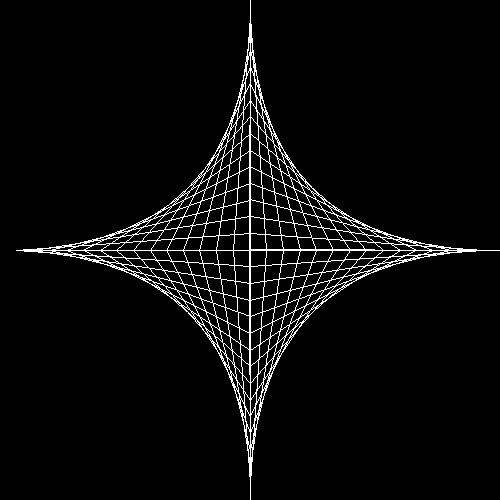
This is just four curves arranged back to back.
Angled Curve
So far I have just looked at curves that use a flat line as their base, but also cheated a little bit in order to combine the offset of the chart and the number of lines on the curve. Drawing the curve in this way means that we are stuck with square or flat baselines, but we can easily fix both of these problems.
The first step is to create a function that allows us to draw a line at a certain angle and length from a given x,y coordinate.
/**
 * Draw a line of a set length, from a given y,x
 *
 * @param resource $image
 *   The image resource.
 * @param int $x1
 *   The X coordinate of the start of the line.
 * @param int $y1
 *   The Y coordinate of the start of the line.
 * @param int $length
 *   The length of the line, in pixels.
 * @param float $angle
 *   The angle of the line, in degrees.
 * @param int $color
 *   The colour resource, created with imagecolorallocate().
 */
function imageAngledLine($image, $x1, $y1, $length, $angle, $color) {
  $x2 = $x1 + sin(deg2rad($angle)) * $length;
  $y2 = $y1 + cos(deg2rad($angle + 180)) * $length;
  imageline($image, $x1, $y1, $x2, $y2, $color);
}
Using this function (and adapting some of the math involved) we can create a generic function to draw a parabolic curve with a given set of attributes anywhere we like.
/**
 * Draw a parabolic curve between two angled lines.
 *
 * @param resource $img
 *   The image resource.
 * @param int $centerX
 *   The x coordinate of the baseline.
 * @param int $centerY
 *   The x coodinate of the baseline.
 * @param int $length
 *   The length of the baselines, in pixels.
 * @param float $xAngle
 *   The angle of the x baseline, in degrees.
 * @param float $yAngle
 *   The angle of the y baseline, in degrees.
 * @param int $increment
 *   The amount of increment between each line. A value of 1 will make a solid
 *   curve.
 * @param int $colour
 *   The colour to use to draw the lines.
 */
function drawCurve($img, int $centerX, int $centerY, int $length, float $xAngle, float $yAngle, int $increment, $colour) {
  imageAngledLine($img, $centerX, $centerY, $length, $xAngle, $colour);
  imageAngledLine($img, $centerX, $centerY, $length, $yAngle, $colour);

  for ($i = $increment; $i < $length; $i = $i + $increment) {
    $x3 = $centerX + sin(deg2rad($xAngle)) * $i;
    $y3 = $centerY + cos(deg2rad($xAngle + 180)) * $i;

    $x4 = $centerX + sin(deg2rad($yAngle)) * ($length - $i);
    $y4 = $centerY + cos(deg2rad($yAngle + 180)) * ($length - $i);

    imageline($img, $x3, $y3, $x4, $y4, $colour);
  }
}
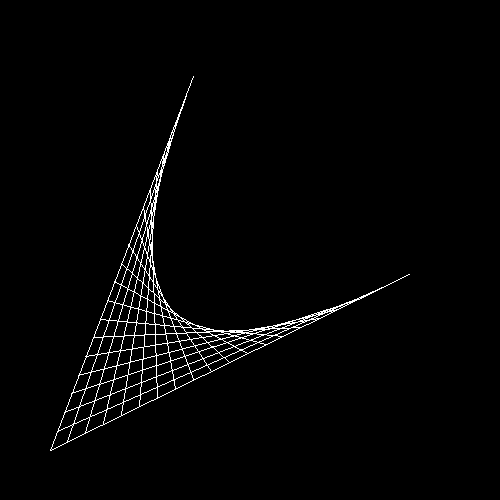
We can use this function in the following way do draw a parabolic curve at the coordinates 50,450.
drawCurve($img, 50, 450, 400, 21, 64, 20, $white);
This generates the following image.
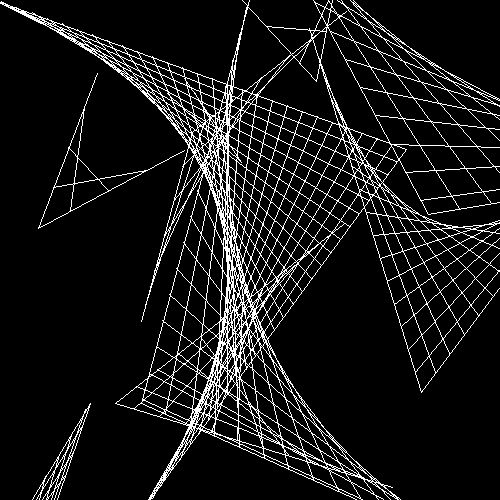
Now that we have a generic function that we can use to draw a parabolic curve we can do more interesting things with it. For example, we can draw 10 curves, with random angles and increments, in random places across an image using the following loop (assuming we still have a canvas size of 500 pixels).
for ($i = 0; $i < 10; $i++) {
  drawCurve($img, rand(0, 450), rand(0, 450), rand(100, 500), rand(0, 360), rand(0, 360), rand(15, 50), $white);
}
This loop produces something like the following image, but it will be different every time the code is run.
We have now done about as much as we can with a flat line parabolic curve, the only other thing to do is draw the curves in different arrangements, which we can now do easily with the above code. So, lets draw a curve using a different shape.
A Parabolic Curve Inside A Circle
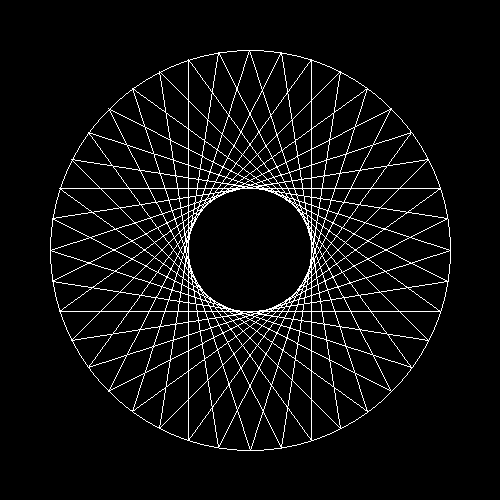
The amazing thing about parabolic curves is that they aren't confined to be drawn on two lines. It is also possible to create them on other structures, like circles for instance.
To draw a parabolic curve inside a circle we need to draw a circle as the base line and then calculate the location of the points along the circumference of the circle. Once we have this information we can draw lines between different pairs of points.
Let's start by setting up some variables that we'll need for the creation of the drawing.
// Set up some variables.
$length = 400;
$radius = $length / 2;
$points = [];
$numberOfPoints = 40;
$slice = 2 * pi() / $numberOfPoints;
To draw a circle in PHP we need to use the imageellipse() function. This function takes the center of the circle and the height and width of the ellipse. Since we want to draw a circle in the middle of the image we set the coordinates to be half the height and width and set the height and width of the ellipse to be the same, which creates a circle.
// Draw the base line.
imageellipse($img, $height / 2, $width /2, $length, $length, $white);
With that in place we need to calculate the coordinates of points around the circumference of the circle. We use the $numberOfPoints and $slice variables to work this out, but in this case we are just populating an array with the coordinates and not drawing any lines.
// Find a point on the circle for each of the points.
for ($i = 0; $i < $numberOfPoints; $i++) {
  $angle = $slice * $i;
  $x = ($width / 2 + $radius * cos($angle));
  $y = ($height / 2 + $radius * sin($angle));
  $points[] = ['x' => $x, 'y' => $y];
}
Now that we have the coordinates of the points around the circle we just need to use the imageline() function to draw a line between each one. In order to work out the next point in the coordinate list we use a bounded increment calculation so that if we go beyond the end of the array we will loop back to the start again.
// Draw lines between pairs of the points on the baseline.
$nextIncrement = $numberOfPoints / 2.5;
for ($i = 0; $i < count($points); $i++) {
  $next = (($i + $nextIncrement) + (count($points))) % (count($points));
  imageline($img, $points[$i]['x'], $points[$i]['y'], $points[$next]['x'], $points[$next]['y'], $white);
}
This code generates the following image.
There are lots more things to do with parabolic curves. We can draw with different coloured lines or fill in the gaps with colours to create intricate patters. I'll leave this here for now, but feel free to use the code here to experiment and create your own parabolic curves.

Add new comment