Benford's Law is an interesting heuristic in data analysis. It states that in any large collection of numbers that are created naturally, you should expect to see numbers starting with the number 1 about 30% of the time. The frequency distribution of numbers states that 2 should appear about 17% of the time, down to 9 being seen just 5% of the time.
It's important to understand the term "naturally created" here. Essentially, Benford's Law looks at the tendency of created numbers to span orders of magnitude. This means that numbers from company accounts, invoices, bills, or any other financial record will follow Benford's Law. These systems have numbers that are very small along side numbers that are very large and so comparing them using a logarithmic scale shows that they clump together.
This means that any data set that is made up of values that are created from recorded data, rather than a randomly created set of values, can be tested with Benford's Law. The law is actually used in financial systems to detect fraud as it becomes possible to see if the numbers have been created naturally or if something has influenced those numbers.
If you remember the Enron scandal from 2001, where the company collapsed due to widespread accounting fraud. The fraud was uncovered by applying Benford's Law to their financial records, which showed that they did not follow the correct distribution of digits for what should have been naturally occurring data.
In this article we will look at how to calculate Benford's Law and then applying the law against a series of data sets to see if we can spot any issues.
Benford's Law is essentially a calculation of the proportion of each digit from 1 to 9. This can be calculated using the following function.
function benford($num) {
  return log10(1 + (1 / $num));
}
To compare this calculated value our dataset we just need to extract the number of times each digit appears at the start of numbers and then divide this by the total number of numbers.
Let's extract some data from a CSV file, in this case we will use PHP.
First, we open the CSV file.
$file = 'data.csv';
$fh = fopen($file, "r");
Then, we loop through the data and extract a count of the number of times each number between 1 and 9 appears in our data.
// Create an array of keys between 1 and 9.
$numbers = array_flip(range(1, 9));
$total = 0;

while (($data = fgetcsv($fh, 0, ',')) !== FALSE) {
  // Extract value from CSV.
  $number = $data[0];

  // Get the first digit.
  $digit = substr(trim($number), 0, 1);

  if(isset($numbers[$digit])) {
    // If the digit exists, then count it.
    $numbers[$digit]++;
    $total++;
  }
}
This will give us an array with the numbers 1 to 9 as the keys and the incidence of each number as the value. Along with the total count of numbers processed.
Now, we just need to calculate the ratio of numbers, both for our data set and for Benford's Law.
$data = [];

$minValue = 1;
$maxValue = 0;

foreach($numbers as $digit => $count) {
  $numberRatio = number_format($count/$total, 3);
  $benfordRatio = number_format(benford($digit), 3);

  $min = min($numberRatio, $benfordRatio);
  $max = max($numberRatio, $benfordRatio);

  if ($min < $minValue) {
    $minValue = $min;
  }
  if ($max > $maxValue) {
    $maxValue = $max;
  }

  $data[$digit] = [
    $numberRatio,
    $benfordRatio,
  ];
}
We can now print out the results in a little CSV export.
echo "#,data,benford" . PHP_EOL;
foreach ($data as $digit => $item) {
  echo $digit . ',' . $item[0] . ',' . $item[1] . PHP_EOL;
}
To test this I downloaded a couple of years of transactions from my own bank account, and then used the above code to generate the following table.
#,data,benford
1,0.301,0.301
2,0.175,0.176
3,0.171,0.125
4,0.080,0.097
5,0.102,0.079
6,0.054,0.067
7,0.060,0.058
8,0.066,0.051
9,0.041,0.046
This looks like it matches Benford's Law, but it's much better to see the relationship if we create a graph from the data.
So, let's create a graph to show the relationship between these two numbers in a graphical form. The following code takes the above array as an input and generates an image file containing a graph.
$height = 400;
$width = 700;

// Create the image.
$image = imagecreatetruecolor($width, $height);

// Set the thickness of lines to 5 pixels.
imagesetthickness($image, 5);

// Set the background colour.
$backgroundColour = imagecolorallocate($image, 255, 255, 255);
imagefilledrectangle($image, 0, 0, $width, $height, $backgroundColour);

// Set the line colours.
$lineColour = imagecolorallocate($image, 0, 0, 255);
$baseLineColour = imagecolorallocate($image, 128, 128, 128);
$benfordLineColour = imagecolorallocate($image, 0, 0, 128);

// Offset the height and width.
$height -= 10;
$width -= 10;

// Draw the background of the chart.
imageline($image, 10, 10, 10, $height, $baseLineColour);
imageline($image, 10, $height, $width, $height, $baseLineColour);

$height = $height - 100;

// Calculate the corrected distance between each point in the chart.
$barWidth = ($width) / (count($data) - 2) - 1;

// Draw the lines in chart.
for ($i = 1; $i < count($data) -1; $i++) {
  // Data data line.
  $value = $data[$i][0] ?? 0;
  $nextValue = $data[$i + 1][0] ?? 0;

  $x1 = floor(($i - 1) * $barWidth) + 10;
  $x2 = floor($x1 + $barWidth - 1);
  $y1 = $height - round($height * (($value - $minValue) / ($maxValue - $minValue))) + 10;
  $y2 = $height - round($height * (($nextValue - $minValue) / ($maxValue - $minValue))) + 10;
  imageline($image, $x1, $y1, $x2, $y2, $lineColour);

  // Draw Benford Law line.
  $value = $data[$i][1] ?? 0;
  $nextValue = $data[$i + 1][1] ?? 0;

  $x1 = floor(($i - 1) * $barWidth) + 10;
  $x2 = floor($x1 + $barWidth - 1);
  $y1 = $height - round($height * (($value - $minValue) / ($maxValue - $minValue))) + 10;
  $y2 = $height - round($height * (($nextValue - $minValue) / ($maxValue - $minValue))) + 10;
  imageline($image, $x1, $y1, $x2, $y2, $benfordLineColour);
}

// Output image.
imagepng($image, 'benfords_law_' . str_replace('.csv', '', $file) . '.png');
This produces the following with the values I got out of my bank account, which follows Benford's Law exactly.
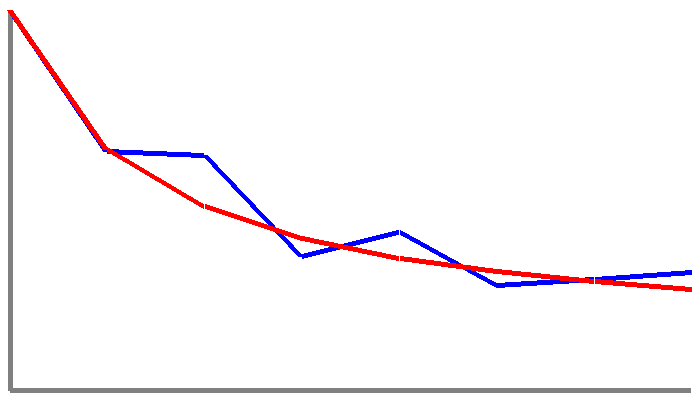
It's actually reassuring when you test data that you know should follow the rule and it follows it very neatly indeed.
Flushed with this success, I decided to look into some other data sets using this graph. To that end I found some open datasets on GitHub that can be probed for some of this information.
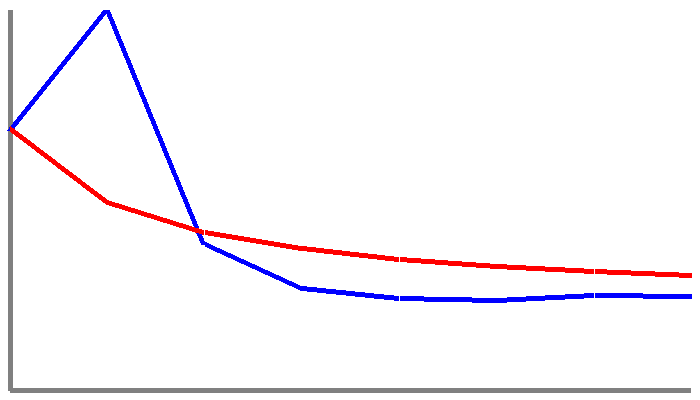
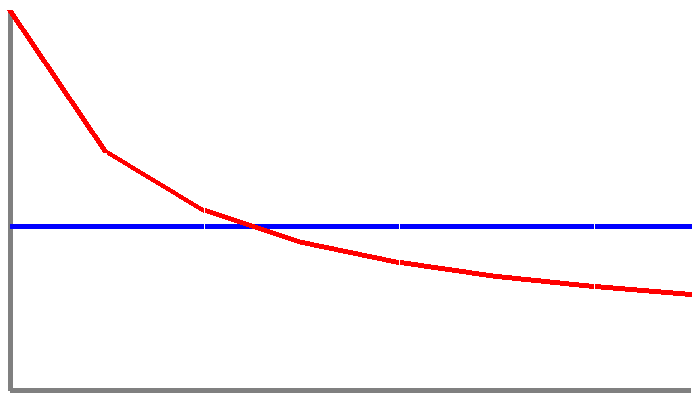
I downloaded a database of UFO sightings and analysed the duration of the encounter in minutes. Although the dataset only had a few thousand items in it, Benford's Law was still somewhat clear in the data.

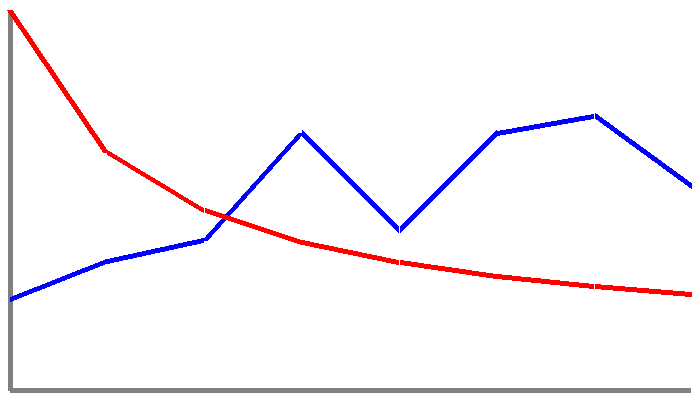
The engine torque in pounds per feet of a large number of cars. This has a small spike at the start due to the large number of engine torque values that start with 2, but follows the general rule of Benford's Law outside of this.
I was curious to see what some artificial datasets would do with Benford's Law, so I made up a few data sets to see what would happen.
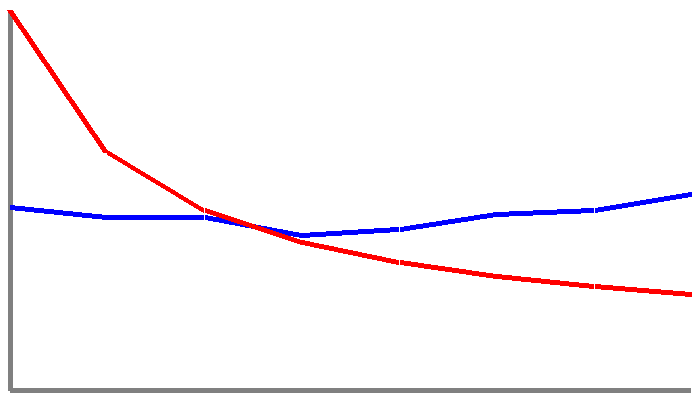
I typed in a few hundred lines of random numbers into the keyboard and processed this with the above code. It's clear that this data doesn't follow Benford's Law at all, but it does show very clearly that the law works to show any data that isn't created naturally.
I also generated some random numbers that using a simple bit of code.
The numbers 1 to 1,000,000 in sequence, just to see what it would do.
It's very clear from all of these data set that random or artificially created numbers produce results that don't follow the Benford's Law line at all. As soon as I started entering numbers myself the results created lines that didn't match the ideal line even slightly.
Conclusion
Remember that this is a heuristic and not a hard fact about all data. Benford's Law won't work when the data set is too small, doesn't cross a magnitude scale, or hasn't been created naturally. It's not a one size fits all solution for detecting made up numbers.
That being said, if you create the ratio of numbers on a data set you have and it doesn't match Benford's Law then it might be a good idea to dig into the data to see what is going on.
Financial records that do not match Benford's Law is a big red flag that should be taken seriously. If something (or someone) has altered that data set then it will show up when you calculate the ratio of first digits as an outlier in the data. If someone makes up a dataset entirely then it won't follow Benford's law at all and you can clearly see this in the graphs above.
I see Benford's Law is more or less like the bell curve in statistical analysis of data. If you have a set of data, especially things like exam results, or experimental results, then you should see a nice bell curve with small numbers at the low and high end, and a single peak in the middle.
A bell curve with two or more peaks suggests that there is some external factor acting on the on the results that is causing the split to happen that you should dig in to figure out what has happened.
If this interests you then you might like looking into Zipf's law, which looks at the proportional frequency of distributions in a data set.

Add new comment