If you've ever looked at the settings in a digital camera, or have experience with image processing programs like GIMP, then you may have seen a colour histogram. This is a simple graph that shows the amount of different shades of colour are present in the image.
They are created by looking at the number of colours in a given image and them mapping their red, green and blue values against a the frequency of their occurrence in the image.
Colour histograms are useful for looking at the overall colour distribution within an image and can also be used to simplify the colours of an image by restricting how much of a certain colour is allowed based on its frequency.
In this article I will look at extracting the colour frequency from an image and generating a histogram based on the information found. We'll look at using colour ranges to segment the colour frequency into bins to create a simplified analysis.
Generating The Colour Frequencies
To generate the colour frequency of an image we just need to loop through every pixel of that image and analyse the colour of that pixel. We do this in PHP by using functions like imagecreatefrompng() or imagecreatefromjpeg() to load the image into memory. Once we have the reference to the image we can use the imagecolorat() PHP function can be used to find the colour, which will return an integer representation of the colour of the pixel. Using this information we can extract the red, green, and blue parts of the colour by using bitshift operations on the integer value.
The following code will open an image and fine the red, green, and blue colour components of the pixel at the coordinates 20, 20.
$image = imagecreatefrompng('image.png');
$rgb = imagecolorat($image, 20, 20);
$red = ($rgb >> 16) & 0xFF;
$green = ($rgb >> 8) & 0xFF;
$blue = $rgb & 0xFF;
Using this as a basis, we can quickly build up the code needed to translate an image file into a multi-dimensional array of the amount of different colours. Here is the function in full.
/**
 * Extract the RBG colour amounts from an image file.
 *
 * This will return an array in the form of the following array, assuming that
 * the image consists of a single colour of FF0000.
 *
 * <code>
 * [
 *   r => [
 *     255 => 1
 *   ],
 *   g => [
 *     125 => 1
 *   ],
 *   b => [
 *     0 => 1
 *   ],
 * ]
 * </code>
 *
 * @param string $imageFile
 *   The image file name to extract.
 *
 * @return array[]
 *   The array of colour amounts.
 */
function extractColourAmountData($imageFile):array {
  if (!file_exists($imageFile)) {
    throw new \InvalidArgumentException('File not found ' . $imageFile);
  }

  // Load the image.
  switch(pathinfo($imageFile, PATHINFO_EXTENSION)) {
    case 'png':
      $image = imagecreatefrompng($imageFile);
      break;
    case 'jpg';
      $image = imagecreatefromjpeg($imageFile);
      break;
  }

  if (!isset($image)) {
    throw new \InvalidArgumentException('File extension not found for ' . $imageFile);
  }

  // Get the dimensions of the image
  $width = imagesx($image);
  $height = imagesy($image);

  // Create an array to store the colour count.
  $colourAmounts = [
    'r' => [],
    'g' => [],
    'b' => [],
  ];

  // Loop through each pixel in the image.
  for ($x = 0; $x < $width; $x++) {
    for ($y = 0; $y < $height; $y++) {
      // Get the RGB values of the pixel.
      $rgb = imagecolorat($image, $x, $y);
      $r = ($rgb >> 16) & 0xFF;
      $g = ($rgb >> 8) & 0xFF;
      $b = $rgb & 0xFF;

      // Increment the count for each colour parts.
      if (isset($colourAmounts['r'][$r])) {
        $colourAmounts['r'][$r]++;
      } else {
        $colourAmounts['r'][$r] = 1;
      }

      if (isset($colourAmounts['g'][$g])) {
        $colourAmounts['g'][$g]++;
      } else {
        $colourAmounts['g'][$g] = 1;
      }

      if (isset($colourAmounts['b'][$b])) {
        $colourAmounts['b'][$b]++;
      } else {
        $colourAmounts['b'][$b] = 1;
      }
    }
  }

  // Clean up file handle.
  imagedestroy($image);

  return $colourAmounts;
}
Once we have finished analysing the colours we can destroy the reference to the image since we have all the information we need.
This function generates an array that counts the frequency of colours found in the image, which can be quite a lot of information for images with lots of colours.
Let's take a very simple image of a black background with a white dot in the middle.
To extract the colour frequency data we just pass in the name of the image and print out the result.
$array = extractColourAmountData('whitespot.png');
print_r($array);
As this image doesn't have much colour variation the resulting colour frequency data is quite small.
Array
(
    [r] => Array
        (
            [0] => 127472
            [223] => 24
            [248] => 32
            [253] => 32
            [254] => 72
            [255] => 1968
        )

    [g] => Array
        (
            [0] => 127472
            [223] => 24
            [248] => 32
            [253] => 32
            [254] => 72
            [255] => 1968
        )

    [b] => Array
        (
            [0] => 127472
            [223] => 24
            [248] => 32
            [253] => 32
            [254] => 72
            [255] => 1968
        )

)
Note though, that it doesn't consist of just black and white colours, there are also a small collection of light colours coming though. This is because the drop off between the spot and the black background isn't perfect, and consists of some off-white pixels that provide transition between the two colours. The image was created in GIMP and that software seems to automatically add some anti-aliasing to pixels at the edge of a brush stroke.
The next step is to use this information to generate the histogram.
Generating The Histogram
What we need to do now is convert this data into an image that contains the histogram. We are generating a "combined" histogram here that contains information for all of the colours extracted from the original image.
The function itself is quite long, but contains the needed elements to generate the combined histogram and also add a colour reference at the bottom of the image for each of the red, green, and blue channels. All of this is worked out on a percentage basis, with the bottom 10% of the image taken up by the colour reference charts. We make use of the function imagefilledrectangle(), which we can use to draw rectangles of different height in the image.
The first step in this process is to figure out the biggest value of each of the channels, which will feed into the creation of the histogram itself. Once that step is complete we can then draw the histogram itself, using the maximum value to offset the graph so that the highest value found always hits the top of the chart. The colour of each of the charts is set to have an alpha value of 80%, which means that if we layer more than one bars over themselves we can still see the data of all parts of the chart.
Here is the function in full.
/**
 * Render a histogram from a given set of colour amounts.
 *
 * @param array $colourAmounts
 *   The colour amounts (as generated by extractColourAmountData()).
 * @param string $histogramFilename
 *   The filename to name the generated histogram image. The extension .png
 *   will automatically be appended to the filename.
 * @param int $height
 *   The height of the generated histogram image.
 * @param int $width
 *   The width of the generated histogram image.
 */
function generateCombinedHistogram(array $colourAmounts, string $histogramFilename = 'histogram', int $height = 1000, int $width = 1000):void {
  // Bottom 10 % of image is the area for the colour bars.
  $bottomColourDisplay = $height * 0.10;

  // Sort out the height of the histogram.
  $correctHeight = $height - $bottomColourDisplay;

  // Create a blank image based on the passed parameters.
  $image = imagecreatetruecolor($width, $height);

  // Fill the image with the background colour
  $background_colour = imagecolorallocate($image, 48, 48, 48);
  imagefilledrectangle($image, 0, 0, $width, $height, $background_colour);

  // Allocate colours for the chart.
  $red = imagecolorallocatealpha($image, 255, 0, 0, 80);
  $green = imagecolorallocatealpha($image, 0, 255, 0, 80);
  $blue = imagecolorallocatealpha($image, 0, 0, 255, 80);

  // Calculate the width of the bar based on the width of the image.
  $barWidth = $width / 256;

  // Find the biggest count value of the colour data. This will be the highest
  // point in the generated histogram.
  $maxValue = 0;
  foreach ($colourAmounts as $colourCount) {
    $tmpMaxValue = max($colourCount);
    if ($tmpMaxValue > $maxValue) {
      $maxValue = $tmpMaxValue;
    }
  }

  // Set a default value of the current colour.
  $colourReference = $red;

  // Loop through each of the colours.
  foreach ($colourAmounts as $colour => $colourCount) {
    // Assign the colour to be used for this block.
    switch ($colour) {
      case 'r':
        $colourReference = $red;
        break;
      case 'g':
        $colourReference = $green;
        break;
      case 'b':
        $colourReference = $blue;
        break;
    }

    // Loop through all the colour values for each colour given and create a
    // bar for the given height of the chart, calculated against the max value
    // for the frequencies found.
    for ($i = 0; $i <= 256; $i++) {
      $value = $colourCount[$i] ?? 0;
      $x1 = $i * $barWidth;
      $x2 = $x1 + $barWidth - 1;
      $y1 = round($correctHeight - ($value / $maxValue) * $correctHeight);
      $y2 = $correctHeight;
      imagefilledrectangle($image, $x1, $y1, $x2, $y2, $colourReference);
    }
  }

  // Loop through all the colour values for each colour to generate a reference
  // graph at the bottom of the histogram for red, green and blue values.
  $redHeight1 = $height - ($bottomColourDisplay * 0.33);
  $redHeight2 = $height;

  $greenHeight1 = $height - ($bottomColourDisplay * 0.66);
  $greenHeight2 = $height - ($bottomColourDisplay * 0.33);

  $blueHeight1 = $height - ($bottomColourDisplay * 0.99);
  $blueHeight2 = $height - ($bottomColourDisplay * 0.66);

  for ($i = 0; $i <= 255; $i++) {
    $colourBarRed = imagecolorallocate($image, $i, 0, 0);
    $colourBarGreen = imagecolorallocate($image, 0, $i, 0);
    $colourBarBlue = imagecolorallocate($image, 0, 0, $i);
    $x1 = $i * $barWidth;
    $x2 = $x1 + $barWidth - 1;
    imagefilledrectangle($image, $x1, $redHeight1, $x2, $redHeight2, $colourBarRed);
    imagefilledrectangle($image, $x1, $greenHeight1, $x2, $greenHeight2, $colourBarGreen);
    imagefilledrectangle($image, $x1, $blueHeight1, $x2, $blueHeight2, $colourBarBlue);
  }

  // Output the image to a file.
  imagepng($image, $histogramFilename . '.png');

  // Clean up file handle.
  imagedestroy($image);
}
To use this function we just pass in the frequency data we extracted from the extractColourAmountData() function and tell the function where to put the resulting image.
With the white spot image we created earlier we pass in the data and tell the function to render the histogram in a file called "whitespot.png" in the directory "histogram", just to keep it separate from the original image.
generateCombinedHistogram($array, 'histogram/whitespot');
Running this code results in the following image.

This histogram isn't very interesting as our test image just creates a massive spike on the far left hand side of the output for the black and a very small spike on the far right hand side (for the white colours).
Some Examples Of The Histograms
Here are a couple of examples of test images that generate much more interesting histograms.
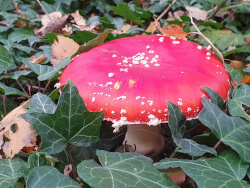
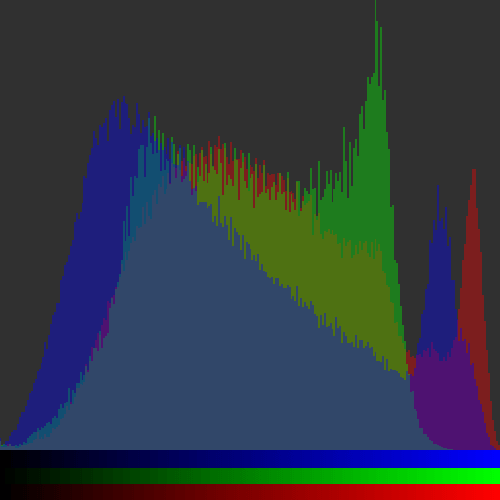
The mushroom image (which I used for my study on steganography in PHP) is a good example as it contains different variations of the prime colours.
This generates the following histogram.
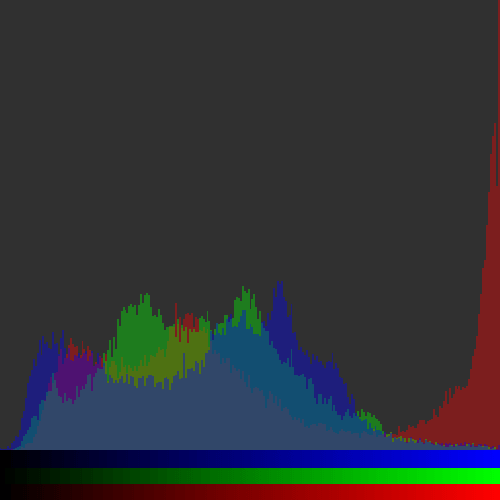
This shows clearly the red spike on the right hand side of the image that correlates with the bright red top of the mushroom from the original image. There is also an abundance of green and blue from the leaves surrounding the mushroom.
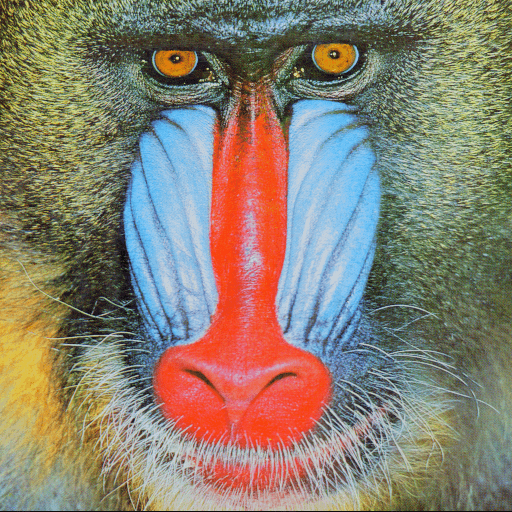
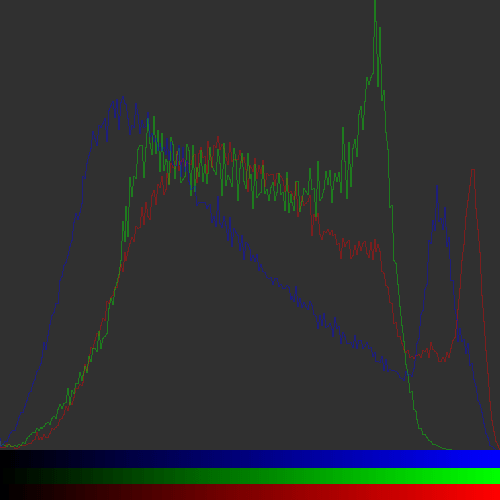
No study on images would be complete without using the classic baboon image (used in a lot of different studies, including ones generating histograms), so let's take a look at this.
Passing this through the functions above produces the following histogram.
This is a good test image as it creates lots of spikes in different parts of the image. The bright red nose of the baboon creates a spike in the lighter coloured reds in the image. The blue cheeks also creating a blue spike in the lighter blue colours in the resulting histogram.
Creating Line Graph Histograms
The histograms we have created so far contain bar charts to represent the colour frequency. This makes sense as the data being generated is non-contiguous, meaning that one value doesn't feed into the next. The problem with this approach is that it does mean the graphs themselves get a bit messy. The histogram of the baboon, for example, has a large section in the middle with different colours of red, green, and blue being printed out in the same section, which makes it difficult to see the detail of the image.
Despite the data being non-contiguous, we can still represent the histogram as a line chart by changing just a few settings in the histogram generation. Instead of using imagefilledrectangle() we use the imageline() function to draw a line between one colour frequency at the next. The only part of the function we need to change is the section that loops through all of the colour frequencies and generates the colours.
    for ($i = 0; $i <= 256; $i++) {
      $value = $colourCount[$i] ?? 0;
      $nextValue = $colourCount[$i + 1] ?? 0;
      $x1 = $i * $barWidth;
      $x2 = $x1 + $barWidth - 1;
      $y1 = round($correctHeight - ($value / $maxValue) * $correctHeight);
      $y2 = round($correctHeight - ($nextValue / $maxValue) * $correctHeight);

      imageline($image, $x1, $y1, $x2, $y2, $colourReference);
    }
In the above code, we find the next value in the $colourCount array and if this value isn't set then we just assume that it's 0. All other parts of the generateCombinedHistogram() stay the same as before.
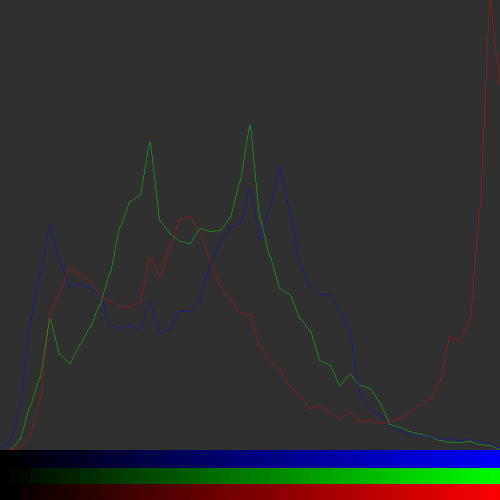
When we run this new histogram generation code against the baboon image we see the following histogram being generated.
It is much easier to see the different colours here, even though they are closely merged together.
Colour Range Histograms
Another variant of the histogram is to use colour ranges (or "bins") when calculating the frequency of the colours in the image. This means that instead of adding every colour we find to the frequency data we instead map the values we find into a given range. This essentially creates an average value of the colours and means that the resulting histogram is simplified.
The best way to do this is to map the range of the colour into another range of numbers using a map function.
/**
 * Map a value between scales.
 *
 * @param int|float $value
 *   The value to map.
 * @param int|float $valueRangeStart
 *   The value range start.
 * @param int|float $valueRangeEnd
 *   The value range end.
 * @param int|float $newRangeStart
 *   The new range start.
 * @param int|float $newRangeEnd
 *   The new range end.
 *
 * @return int|float
 *   The new value, mapped to the new range.
 */
function map($value, $valueRangeStart, $valueRangeEnd, $newRangeStart, $newRangeEnd) {
  return $newRangeStart + ($newRangeEnd - $newRangeStart) * (($value - $valueRangeStart) / ($valueRangeEnd - $valueRangeStart));
}
Using this function, if we set the maximum bin size to 50, then a colour with the value of 255 would be mapped to the value of 50.
Let's modify the extractColourAmountData() and create a extractRangedColourAmountData() function that maps the colour values into a given range. The top end of the range is passed as an additional parameter to the function, which is defaulted to 50.
/**
 * Extract the RBG colour amounts from an image file.
 *
 * This will return an array in the form of the following array, assuming that
 * the image consists of a single colour of FF0000. The colours will also be
 * segmented by the binMax value (defaulted to 50)
 *
 * <code>
 * [
 *   r => [
 *     10 => 1
 *   ],
 *   g => [
 *     50 => 1
 *   ],
 *   b => [
 *     0 => 1
 *   ],
 * ]
 * </code>
 *
 * @param string $imageFile
 *   The image file name to extract.
 * @param int $binMax
 *   (Optional) The maximum bin size to set.
 *
 * @return array[]
 *   The array of colour amounts.
 */
function extractRangedColourAmountData($imageFile, $binMax = 50):array {
  if (!file_exists($imageFile)) {
    throw new \InvalidArgumentException('File not found ' . $imageFile);
  }

  // Load the image.
  switch(pathinfo($imageFile, PATHINFO_EXTENSION)) {
    case 'png':
      $image = imagecreatefrompng($imageFile);
      break;
    case 'jpg';
      $image = imagecreatefromjpeg($imageFile);
      break;
  }

  if (!isset($image)) {
    throw new \InvalidArgumentException('File extension not found for ' . $imageFile);
  }

  // Get the dimensions of the image
  $width = imagesx($image);
  $height = imagesy($image);

  // Create an array to store the colour count.
  $colourAmounts = [
    'r' => [],
    'g' => [],
    'b' => [],
  ];

  // Loop through each pixel in the image.
  for ($x = 0; $x < $width; $x++) {
    for ($y = 0; $y < $height; $y++) {
      // Get the RGB values of the pixel.
      $rgb = imagecolorat($image, $x, $y);
      $r = ($rgb >> 16) & 0xFF;
      $g = ($rgb >> 8) & 0xFF;
      $b = $rgb & 0xFF;

      // Map the colour frequency into a bin.
      $r = round(map($r, 0, 255, 0, $binMax));
      $g = round(map($g, 0, 255, 0, $binMax));
      $b = round(map($b, 0, 255, 0, $binMax));

      // Increment the count for each colour parts.
      if (isset($colourAmounts['r'][$r])) {
        $colourAmounts['r'][$r]++;
      } else {
        $colourAmounts['r'][$r] = 1;
      }

      if (isset($colourAmounts['g'][$g])) {
        $colourAmounts['g'][$g]++;
      } else {
        $colourAmounts['g'][$g] = 1;
      }

      if (isset($colourAmounts['b'][$b])) {
        $colourAmounts['b'][$b]++;
      } else {
        $colourAmounts['b'][$b] = 1;
      }
    }
  }

  // Clean up file handle.
  imagedestroy($image);

  return $colourAmounts;
}
Using this function, the white spot on a black backgound image generates quite different data. Instead of being mapped to a value of 0 to 255, the colours are mapped to a scale of 0 to 50.
This is what the data now looks like.
Array
(
    [r] => Array
        (
            [0] => 127472
            [44] => 24
            [49] => 32
            [50] => 2072
        )

    [g] => Array
        (
            [0] => 127472
            [44] => 24
            [49] => 32
            [50] => 2072
        )

    [b] => Array
        (
            [0] => 127472
            [44] => 24
            [49] => 32
            [50] => 2072
        )

)
The only thing left to do now is to alter the generateCombinedHistogram() function to create a generateRangedCombinedHistogram() function variant. This function also takes the max range value to generate the histogram.
Note that the range value we applied to the original data MUST be the same value used to generate the histogram of the image data. This value is used to calculate the width of the graph and if the values are different the resulting histogram will be oddly skewed.
This is the code of the generateRangedCombinedHistogram() function in full.
/**
 * Render a histogram from a given set of colour amounts with a max range value applied.
 *
 * @param array $colourAmounts
 *   The colour amounts (as generated by extractColourAmountData()).
 * @param string $histogramFilename
 *   The filename to name the generated histogram image. The extension .png
 *   will automatically be appended to the filename.
 * @param int $height
 *   The height of the generated histogram image.
 * @param int $width
 *   The width of the generated histogram image.
 * @param int $binMax
 *   (Optional) The maximum bin size to set. This must be the same as the
 *   value used to generate the colour data.
 */
function generateRangedCombinedHistogramWith(array $colourAmounts, string $histogramFilename = 'histogram', int $height = 1000, int $width = 1000, $binMax = 50):void {
  // Bottom 10 % of image is the area for the colour bars.
  $bottomColourDisplay = $height * 0.10;

  // Sort out the height of the histogram.
  $correctHeight = $height - $bottomColourDisplay;

  // Create a blank image based on the passed parameters.
  $image = imagecreatetruecolor($width, $height);

  // Fill the image with the background colour
  $background_colour = imagecolorallocate($image, 48, 48, 48);
  imagefilledrectangle($image, 0, 0, $width, $height, $background_colour);

  // Allocate colours for the chart.
  $red = imagecolorallocatealpha($image, 255, 0, 0, 80);
  $green = imagecolorallocatealpha($image, 0, 255, 0, 80);
  $blue = imagecolorallocatealpha($image, 0, 0, 255, 80);

  // Calculate the width of the bar based on the width of the image.
  $barWidth = $width / $binMax;

  // Find the biggest count value of the colour data. This will be the highest
  // point in the generated histogram.
  $maxValue = 0;
  foreach ($colourAmounts as $colourCount) {
    $tmpMaxValue = max($colourCount);
    if ($tmpMaxValue > $maxValue) {
      $maxValue = $tmpMaxValue;
    }
  }

  // Set a default value of the current colour.
  $colourReference = $red;

  // Loop through each of the colours.
  foreach ($colourAmounts as $colour => $colourCount) {
    // Assign the colour to be used for this block.
    switch ($colour) {
      case 'r':
        $colourReference = $red;
        break;
      case 'g':
        $colourReference = $green;
        break;
      case 'b':
        $colourReference = $blue;
        break;
    }

    // Loop through all the colour values for each colour given and create a
    // bar for the given height of the chart. Each bar is topped by a square of
    // the same colour.
    for ($i = 0; $i <= $binMax; $i++) {
      $value = $colourCount[$i] ?? 0;
      $nextValue = $colourCount[$i + 1] ?? 0;
      $x1 = $i * $barWidth;
      $x2 = $x1 + $barWidth - 1;
      $y1 = round($correctHeight - ($value / $maxValue) * $correctHeight);
      $y2 = round($correctHeight - ($nextValue / $maxValue) * $correctHeight);

      imageline($image, $x1, $y1, $x2, $y2, $colourReference);
    }
  }

  // Loop through all the colour values for each colour to generate a reference
  // graph at the bottom of the histogram for red, green and blue values.
  $redHeight1 = $height - ($bottomColourDisplay * 0.33);
  $redHeight2 = $height;

  $greenHeight1 = $height - ($bottomColourDisplay * 0.66);
  $greenHeight2 = $height - ($bottomColourDisplay * 0.33);

  $blueHeight1 = $height - ($bottomColourDisplay * 0.99);
  $blueHeight2 = $height - ($bottomColourDisplay * 0.66);

  for ($i = 0; $i <= $binMax; $i++) {
    // Map the colour value to the given range.
    $value = map($i, 0, $binMax, 0, 255);

    $colourBarRed = imagecolorallocate($image, $value, 0, 0);
    $colourBarGreen = imagecolorallocate($image, 0, $value, 0);
    $colourBarBlue = imagecolorallocate($image, 0, 0, $value);

    $x1 = $i * $barWidth;
    $x2 = $x1 + $barWidth - 1;
    imagefilledrectangle($image, $x1, $redHeight1, $x2, $redHeight2, $colourBarRed);
    imagefilledrectangle($image, $x1, $greenHeight1, $x2, $greenHeight2, $colourBarGreen);
    imagefilledrectangle($image, $x1, $blueHeight1, $x2, $blueHeight2, $colourBarBlue);
  }

  // Output the image to a file.
  imagepng($image, $histogramFilename . '.png');

  // Clean up file handle.
  imagedestroy($image);
}
Also note that we are using the range to build the reference charts at the bottom of the histogram. This means that instead of the band of colour we saw previously we now see a segmented colour band representing the amount of segments we decided to use.
Let's look at some examples of using this segmented approach to analyse the image above, using the default band size of 50.
The image of a mushroom significantly smooths out the line created earlier, but we have lost none of the important information about what colours exist in the image.
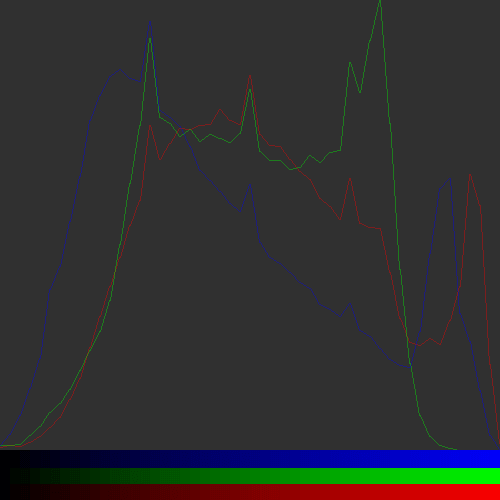
The image of the baboon is similarly simplified. It still shows the red and blue band towards the lighter end of the spectrum, but the middle of the histogram is far less messy.
The above histograms are fairly standard examples of the technique in action. This can be enhanced to use different calculations for the frequency calculations, like passing the numbers through a log function to smooth out the difference between the high and low values.
Feel free to use any of the code you see here in your own image analysis code.

Add new comment