Note: This article assumes that you have a working Apache/PHP environment running with the latest major version of Netbeans (current 7) installed.
Xdebug is a brilliant PHP extension that provides both debugging and profiling tools. From a basic install it will vastly improve the quality of the error messages but it can also be made to interactively debug scripts using a number of different IDE's. It can also be used as a code profiling tool, but I won't be going into that in this post as that is a little beyond the scope of what I will be talking about.
Installation
If you are using XAMMP to host your Apache/PHP environment then you can skip the following step. Xdebug is actually bundled with XAMMP so you just need to enable it by going into your php.ini file and uncommenting the options you need.
With a standalone install of Apache and PHP you will need to download the correct Xdebug binary and point PHP to it. There are various different binary files available, so picking the right one is important in order to get the tool to work correctly. Luckily, the author has created a handy little utility that will allow you to get customised installation instructions based on your current system. In order to do this you need to extract information about your PHP install. This can be done in one of two ways.
- Create a PHP web page with a call to the phpinfo() function. Just select and copy all of the text from this page. Don't copy the view-source of the phpinfo() page as this won't be parsed properly.
- Open up a command prompt and run the command "php -i > phpinfo.txt". This will create an output file that will contain the full output of phpinfo().
To use this output, go to the URL http://xdebug.org/find-binary.php and paste it into the text area. The output of this form (shown below) will be a summary of the environment that PHP is running on (which is always worth a double check) and a set of instructions about what binary file to download, and how to install it. This is the bare minimum needed to get you up and running, but it is worth doing if you have never used Xdebug before.
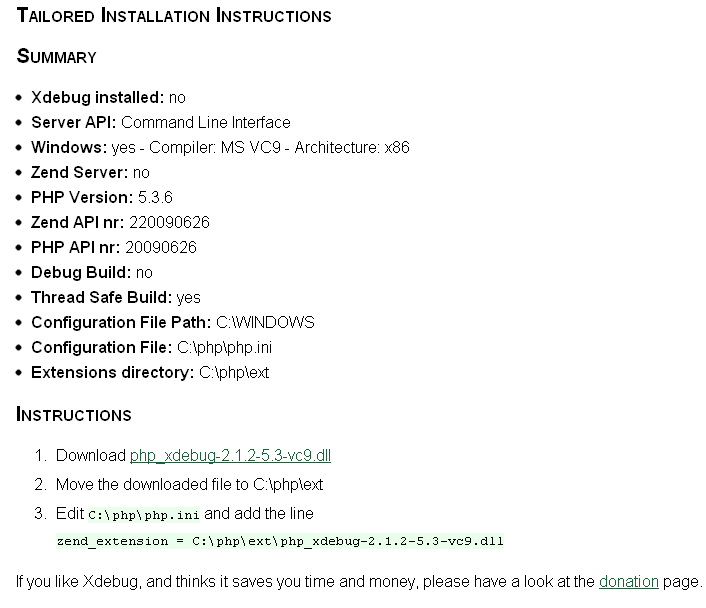
The instructions tell me to grab a copy of the dll file php_xdebug-2.1.2-5.3-vc9.dll, move it to C:\php\ext, and edit my php.ini file so that PHP can pick up the extension. This is the line I added to my php.ini file. You can optionally add the [xdebug] marker as I have done to create a separate config section.
[xdebug]
zend_extension = C:\php\ext\php_xdebug-2.1.2-5.3-vc9.dll
One other thing to note here is that Xdebug produces error messages styled using HTML. This can cause an issue with some versions of PHP as there is now a config setting that will turn on and off this HTML formatting. Search your php.ini file and make sure that the html_errors setting is set to "On".
html_errors = On
Once this is done you'll need to restart Apache for the changes to take effect.
I quickly tested the install had worked by creating and running a PHP script with a syntax error in it. The following orange styled error shows that Xdebug is now installed. You will also be able to see the footprint in your phpinfo() output.

The error messages produced by Xdebug are a great tool in themselves as they give an indication of the call stack, execution time and amount of memory used. To demonstrate this I wrote the following script, which just goes down a few levels of function calls before trying to call a non-existent function, which results in a fatal error.
// start
function1();

function function1() {
	function2();
}

function function2() {
	function3();
}

function function3() {
	// non existent function
	error();
}
The error output (shown below) shows where the error occurred (line 14) and what functions were called before that point. This output is exceptionally useful as the standard PHP errors don't display the call stack.

Remote Debugging In Netbeans
Perhaps the most useful feature of Xdebug is the live code profiling, also known as remote debugging. This allows developers to use their IDE to step through the code, line by line, and inspect the variables and call stack at any time. You can set breakpoints that will stop the code execution at any given point, allowing you to see what is going on. If you are running code through Apache then a browser will be fired up in order to run the code. In previous versions of Xdebug a plugin was required in order to allow communication between Xdebug and the web browser, however these plugins don't seem to be required anymore. As many of our developers work with Netbeans I will concentrate on integrating Xdebug with that IDE, I have used Xdebug with other IDE's and it wasn't difficult to get things up and running.
The first thing you need to do is ensure that your preferred browser is set as the default browser. You can check which browser is going to be used by going to Tools > Options and checking the Web Browser field towards the top of this dialog.
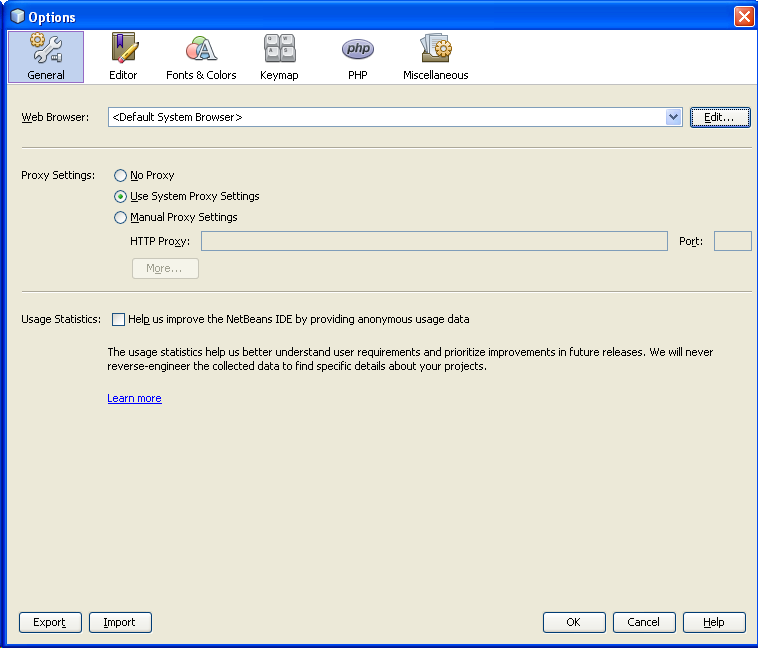
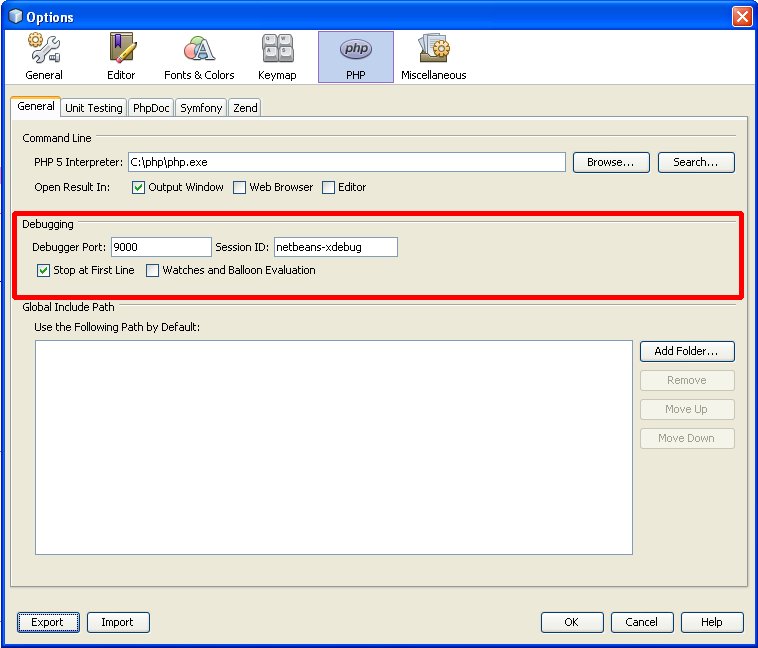
Next, inspect your Xdebug settings in Netbeans by clicking on the PHP logo in the Options dialog. The Xdebug settings are all contained within the red box in the image below. Keep this dialog open until you have finished setting things up.
In order to enable remote debugging we need to open up the system php.ini and add a couple of options to the setup. The most fundamental option needed is enabling remote_enable by giving it a value of 1. Most of the other Xdebug settings available have a default value but setting the core ones needed for remote debugging in your php.ini means that you don't need to look them up if you need to change them. This is what my final Xdebug settings look like on my localhost. Make sure you restart Apache after making these changes.
[xdebug]
zend_extension = C:\php\ext\php_xdebug-2.1.2-5.3-vc9.dll
xdebug.remote_enable=1
xdebug.remote_port=9000
xdebug.remote_handler="dbgp"
xdebug.remote_host="localhost"
One final note before we actually run anything. When you run the a website though the remote debugger in Netbeans it will open up a web browser (as stated before) but the URL that it opens is the one that you set when you created the project. If you have taken this project from an SVN repository that already contained a Netbeans project (stored in a nbproject folder) then you should double check the URL before you start. With your project selected, open the project properties by going to File > Project Properties. This dialog box can also be opened by right clicking on the project name in your project window and selecting Properties. Select the Run Configuration item on the left hand menu and you will see the runtime configuration, which will look something like this.
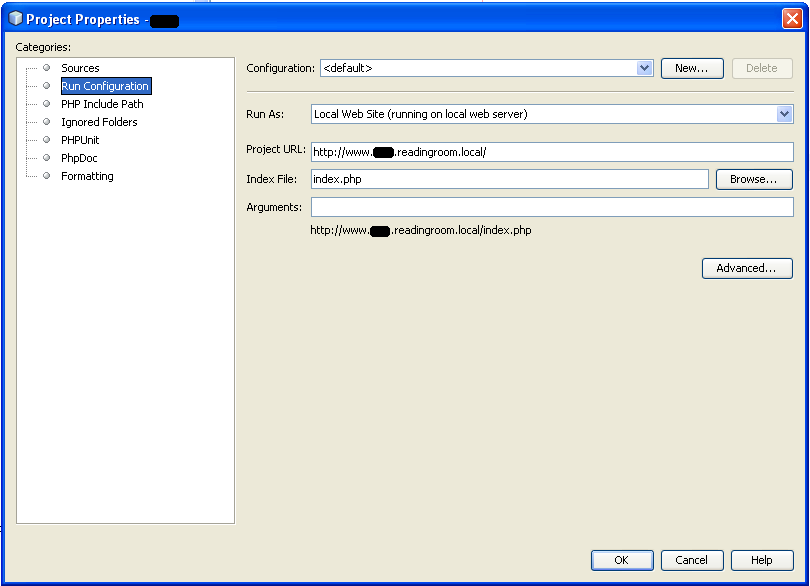
Running the code as a script is also possible, you just need to select the correct Run As setting from the Project Properties dialog. If you do select to run the project as a script then the debugger will run as normal, just without opening the browser. Instead, all of the output produced will be sent to the Output window.
After you have made sure that the project properties are correct you can activate the remote debugger. To do this either click on the debugging button (as shown in the image below) in the menu bar or by pressing Ctrl+F5.

When you run the debugger for the first time it will open a web browser, point it at the website in question (appending XDEBUG_SESSION_START=netbeans-xdebug to the URL) and stop at the first line of executable code that it encounters. This is because in the Xdebug settings there is a checkbox that says "Stop at First Line". Once you are up and running it might be worth unchecking this checkbox. It is a useful test when setting up a system; but I find it annoying after that, as every time a page is loaded the code execution will stop.
The image below is a screenshot of the debugger in action, stopping at the first line of code of a Drupal install. The green highlight shows the current line being executed.
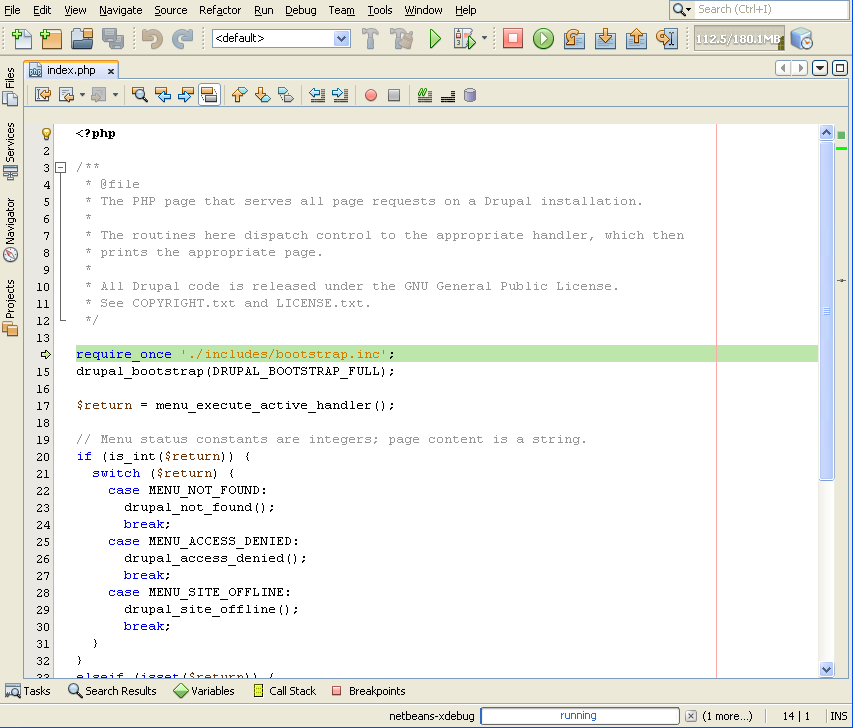
Notice that when the debugger is active a number of extra buttons appear in the menu at the top. These allow you to control the debugger in a number of different ways.

- Finish Debugger Session Shift - This will stop the debugger session and therefore any further code execution. When this happens the browser window will be refreshed with the message "DEBUG SESSION ENDED". When the code is running this is the only button available. The keyboard shortcut for this is Shift + F5.
- Continue - This will continue the execution of the code until the next breakpoint or until the code has finished executing. The keyboard shortcut for this is F5.
- Step Over - This will step through the code, line by line, skipping over any function calls. The keyboard shortcut for this is F8.
- Step Into - This will step through the code, line by line, and will drop into any non-native PHP function calls. The keyboard shortcut for this is F7.
- Step Out - This will run the code until the current function has completed running. The code execution will then stop on the first line after the function was called. The keyboard shortcut for this is Ctrl+F7.
- Run To Cursor - By placing the cursor on a line and pressing this button you can run the code until that line is reached. This is a handy way of running things if you don't want to set a breakpoint. The keyboard shortcut for this is F4.
With the debugger running on an external website you can use the site as you normally would. Navigating around the site and submitting forms will run the debugger on every page request.
Breakpoints
Code execution in debugging mode is always interrupted by breakpoints. You can set a breakpoint anywhere in your code by clicking on the line number, which will highlight the line red. You can also set breakpoints by right clicking on the line and selecting Toggle Line Breakpoint.
With a breakpoint in place you can run the code in debug mode as normal, but when a breakpoint is reached the code will stop at that point. The code execution stops at the beginning of the line, so the contents of the line are not executed until the code is either continued or stepped onwards. The following screenshot shows the main Drupal index.php file being executed, with the code execution stopping on the first line and a breakpoint ready to stop the execution on line 17.

One very important thing to realise is that when in debug mode none of your code changes will be noticed until you reload the script. What this means is if you are stepping through the code and want to change it then you have to either run the code completely or stop it (useful if you don't want some of the code to run). This happens as a result of how PHP works. When a PHP script runs it is compiled and run on the fly, when you are in debug mode there is no way to change these compiled PHP scripts and so any changes you make to the code won't be seen by the PHP engine until it is next run.
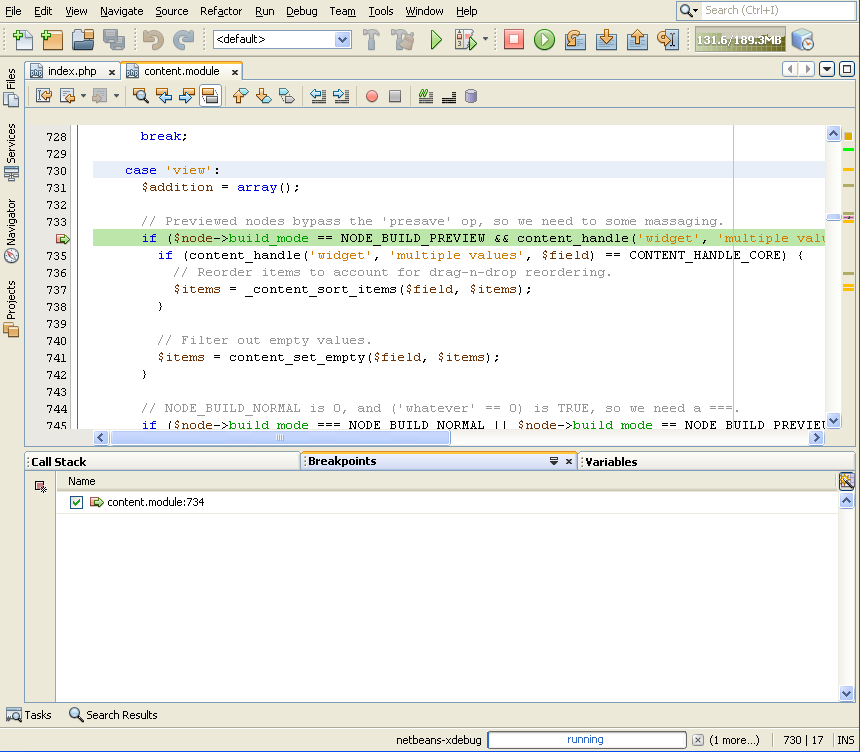
You can view all of the break points throughout your projects via the Breakpoints window (shown below). Be careful with this window as it will show the breakpoints you have set in all of your currently open projects, which can be a bit confusing. The following shows a breakpoint being created in the content module in Drupal and the corresponding entry in the Breakpoints window. You can double click on this entry to be taken to the breakpoint in the code.
Inspecting Variables
While running the debugger you can also inspect the values of any variables set in the script within the current scope and before the current line. The easiest way to do this is to hover over the variable in question, which will show you a tooltip with the type and value of the variable in question. This tooltip has a maximum length, so if you are inspecting arrays or objects then you might find that the output gets cut off.
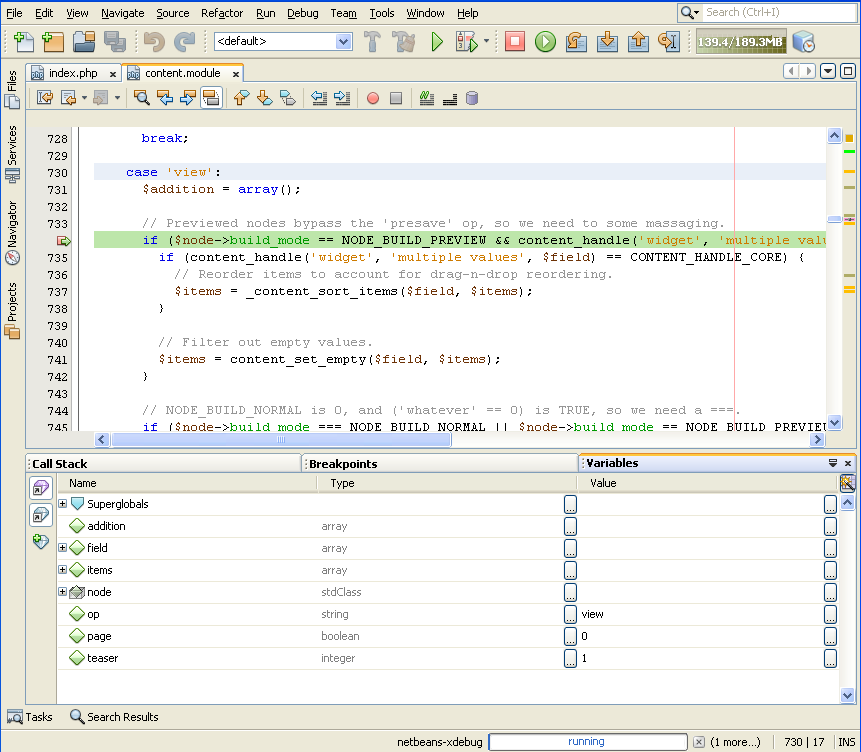
If the variables are too long to inspect in this way then you can open up the Variables window and see the name, type and value of the variables in your currently running script. This window displays a tree structure for objects and arrays so you can drill down into them and view all of the values contained within. The Variables window also shows any superglobal variables that have been set, which includes any post, get, session and server parameters. I find this superglobal variable is very useful, especially when inspecting the input from forms.
The following screenshot shows the variables currently defined within a function call in the content.module file.
The Call Stack
The call stack window shows what functions have been called to get to a particular point in the code. The stack list will show you the file that the function was in, as well as the line that the function was called from.
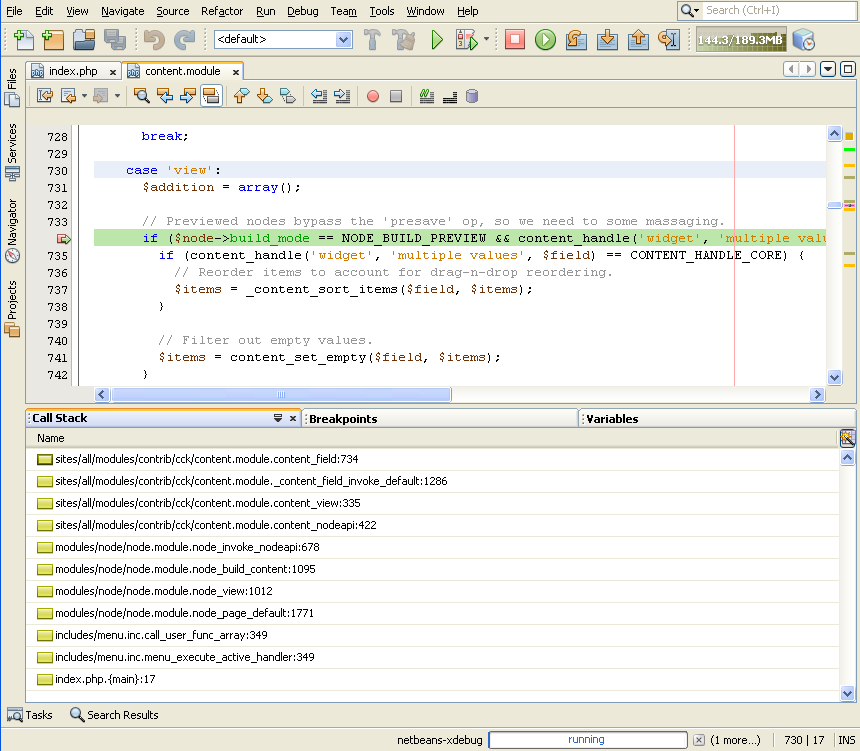
Double clicking on any stack entry will take you to that place in the code. If you do this you will also change the output in the Variables window to match the context of the code you are inspecting, so be careful.
There are a few extra features I haven't gone over here, like Watches and Evaluation results, but the features I have outlined above are enough to make Xdebug and Netbeans a powerful combination. Getting setup with these tools is well worth the time and is vastly superior to adding a bunch of print_r() and die() calls to your code when you are trying to figure out a bug.


 In order to enable remote debugging we need to open up the system php.ini and add a couple of options to the setup. The most fundamental option needed is enabling remote_enable by giving it a value of 1. Most of the other Xdebug settings available have a default value but setting the core ones needed for remote debugging in your php.ini means that you don't need to look them up if you need to change them. This is what my final Xdebug settings look like on my localhost. Make sure you restart Apache after making these changes.


Add new comment