A sparkline is a very small line graph that is intended to convey some simple information, usually in terms of a numeric value over time. They tend to lack axes or other labels and are added to information readouts in order to expand on numbers in order to give them more context.
Sparklines tend to be around 20-30 pixels height and up to 150-200 pixels wide. The are generally best when you want to show between 5 and 15 items as adding more items to such a small graph can make things a little messy.
In this article I will go through the steps needed to generate a sparkline using PHP.
As an example of how sparklines are useful, you might have a list of numbers that shows a count of something over a number of months.

Having the numbers on their own is fine, but you paint a much better picture of the relationship between the numbers if you provide a small line graph next door to the numbers.

The addition of a small chart like this clearly shows an upward trend in the numbers, and we don't need a lot of numbers to show the trend here.
Ultimately, the goal we are aiming for here to to have a generic bit of code that we can use to generate a sparkline for any part of an application. This effect is best achieved using a HTML image tag that calls a PHP script, passing the data we want to represent, and returning the image as data.
Here is an example of generating the above sparkline within the page, using the data we have at hand.
<img src="/sparkline.php?data=10,30,40,20,50,20,40,50,100"/>
As the PHP script returns image data the browser will display this as an image.
Accepting User Input
The data we pass to the script can will be in a comma separated format and so we process passed string to extract the data into an array. Parameters added to the URL are automatically available in PHP through the $_GET superglobal variable.
What we need to do here is make sure that we have data in the $_GET variable, and that it contains more than one data point before processing the data into an array. Passing the value through an is_numberic() check means that we can filter out all non-numeric values from the data. The final value is then add to the $data array.
// Process the passed data.
$data = [];
if (isset($_GET['data']) && str_contains($_GET['data'], ',')) {
    foreach (explode(',', $_GET['data']) as $datum) {
        if (is_numeric($datum)) {
            // Ignore anything that that isn't a number.
            $data[] = $datum;
        }
    }
}
We can do a similar thing with the width and height of the chart, setting a default size of 50x30pixels for the chart, and allowing sizes of up to 300x300 pixels to be set. The optional passed values are cast to an integer to ensure they are round numbers as we can't create an image with a float value for the width and height.
// Define the width.
$width = 50;
if (isset($_GET['w']) && is_numeric($_GET['w']) && $_GET['w'] < 300) {
    // Set the passed width, cast to an integer.
    $width = (int) $_GET['w'];
}

// Define the height.
$height = 30;
if (isset($_GET['h']) && is_numeric($_GET['h']) && $_GET['h'] < 300) {
    // Set the passed height, cast to an integer.
    $height = (int) $_GET['h'];
}
We now have the data for the sparkline and optional custom dimensions for the chart size.
Initialising The Sparkline Image
The first thing we need to do is define the image that we will use to draw the sparkline. This is done using the PHP GD library to generate an image resource. Once we have that the background of the image is set with a white rectangle.
At this point we can perform a check on the $data passed to the script and return this blank chart if we have no data to process. To do this we return a header for the image so that the browser knows what kind of data we are about to return, before calling imagepng() which will print out the image.
// Create the image.
$image = imagecreatetruecolor($width, $height);

// Set the background colour.
$backgroundColour = imagecolorallocate($image, 255, 255, 255);
imagefilledrectangle($image, 0, 0, $width, $height, $backgroundColour);

if (empty($data)) {
    // If the $data is empty then output a blank image.
    header('Content-Type: image/png');
    imagepng($image);
    exit();
}
Stopping execution here prevents any errors or broken images from appearing in your reports.
Alternatively, if we do have data to process then we can define the colours of the lines in our chart.
// Set the line colours.
$lineColour = imagecolorallocate($image, 0, 0, 255);
$baseLineColour = imagecolorallocate($image, 128, 128, 128);
In this case we define blue as the line colour and light grey as the line that represents 0, which will be printed if we have negative numbers.
Drawing The Lines
With the image resource and colours created we can now start drawling the lines in the chart. The first step in this process is to reduce the apparent height of the chart by 1 so that any 0 value actually appears at position 1 in the chart. This prevents any chart that contains one or more data items with the value of 0 from simply not being drawn on the chart.
// Now that we have defined the height of the image ensure 0 on the chart is
// actually 1.
$height--;
In order to calculate the relative heights of the chart we also need to find the maximum and minimum values of the data. This is done using the PHP max() and min() functions.
// Get the maximum value from the data.
$maxValue = max($data);
$minValue = min($data);
Before we draw the lines for our data we need to draw the base line of 0 in the chart, if the chart has both negative and positive values. The height of the line is calculated by mapping the minimum and maximum values of the data against the total height of the chart, which allows the line to be drawn at position 0.
if ($minValue < 0 && $maxValue > 0) {
    // This line crosses the 0 point, so draw the base line of the chart at 0.
    $x1 = 0;
    $x2 = $width;
    $y1 = $height - round($height * ((0 - $minValue) / ($maxValue - $minValue)));
    $y2 = $height - round($height * ((0 - $minValue) / ($maxValue - $minValue)));
    imageline($image, $x1, $y1, $x2, $y2, $baseLineColour);
}
The order of drawing lines in a PHP GD image is important, so we draw the base line first so that we can draw the lines on top of this line.
Finally, we can draw the line for the chart.
// Calculate the corrected distance between each point in the chart.
$barWidth = ($width) / (count($data) -1);

// Draw the line of the chart.
for ($i = 0; $i < count($data) -1; $i++) {
    $value = $data[$i] ?? 0;
    $nextValue = $data[$i + 1] ?? 0;
    $x1 = floor($i * $barWidth);
    $x2 = floor($x1 + $barWidth - 1);
    $y1 = $height - round($height * (($value - $minValue) / ($maxValue - $minValue)));
    $y2 = $height - round($height * (($nextValue - $minValue) / ($maxValue - $minValue)));

    imageline($image, $x1, $y1, $x2, $y2, $lineColour);
}
The last thing to do here is create a header so that the browser know what kind of data we are returning before using imagepng() to print out the image.
// Output image.
header('Content-Type: image/png');
imagepng($image);
Doing this will render the image and return it to the browser. There's no need to exit the script here as this is the last instruction and so the script exits automatically.
Conclusion
This is a really useful technique that adds more context to the data you have in your system. You can even use this to expand on a single value to show the trend of that value over time, which is a more visually appealing way of showing values.
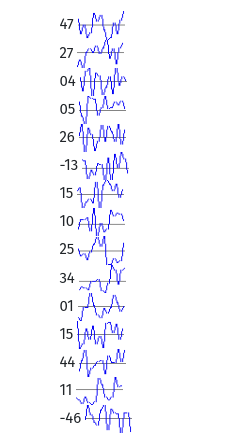
Here is an example of using this technique to expand on single values in a list of numbers.
There are a few improvements that could be made to this script. For example, you could allow users to inject their own colours into the sparkline as these values are currently hard coded into the script. You would need to accept hex values and convert them into the format required for the imagecolorallocate() function.
The main limitation here is that PHP doesn't allow for float values to be used in the imageline() function, which means that we need to round our values before we can use them to draw the line. Due to the small size of the charts, and the rounding of numbers in this way, small precision errors can occur in the lines. This can cause small pixel gaps and to occasionally appear in the charts.
If you want the entire code for this sparkline script then you can find it on this PHP Sparklines github gist.

Add new comment